SAMPLING METHODS
The main sampling methods are:
1) Simple random sampling
2) Systematic sampling
3) Cluster sampling
4) Stratified sampling
Simple random sampling is the recommended method for this assessment but being able to explain alternatives with advantages and disadvantages could improve your grade.
HISTORICAL BACKGROUND
So why sample in the first place?
Your blood is a pretty good indicator of your health. But we don't need to drain all your blood to prove it for obvious reasons. So a sample makes sense. When I go into a shop in Henderson or the Bullring in Birmingham I know a shirt labelled medium size is going to fit me. However not so when I went to Bangkok Thailand. Why would that be?
In reality, there is simply not enough time to measure or record information about every member of the population. Sampling large populations may take up a lot of resources including personnel, money and then there is that isolated village up in the mountains with no internet and cell phone coverage.
Things to consider around sampling.
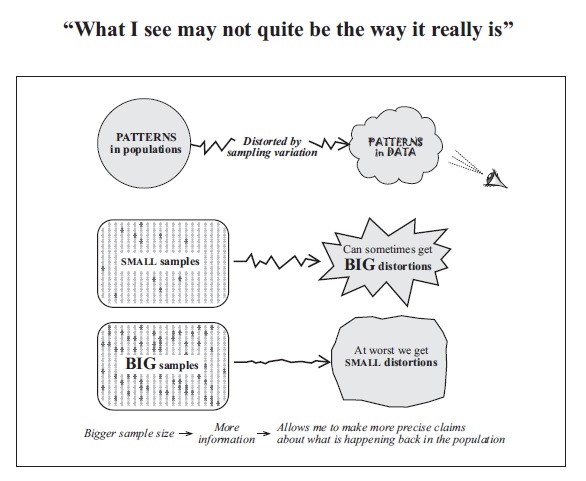
Large sample sizes give a better snapshot of the population parameters. (Pictures - Chris Wild, Statistics guru Auckland University).
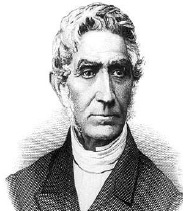
Adolphe Quetelet - Marion Steel EGGS
Surprisingly, the idea that there might be an 'average man' out there in the population is historically quite recent. The American Adolphe Quetelet (1796 - 1874) was an important social statistician who used French and Scottish soldiers to formulate his theories.
However, it was Arthur Lyon Bowley in 1906 who finally pioneered random sampling in statistics. But still it took time to realise that a random sample could represent a population.

Thanks to Arthur Bowley being average never felt so good! (At the Bullring in Birmingham).
SIMPLE RANDOM SAMPLING
Simple random sampling is the easiest of the sampling methods. The data to be sampled (the population) is recorded in a numbered list. A random number is then generated and the data item associated with the random number is selected. For our first activity there are 98 records. The process is repeated until 20 samples have been collected. (you will take 50 samples from each gender in the real assessment). If a data value is chosen twice, discard it and select again. The random number can be generated by a calculator or spread sheet program like EXCEL.
The formula INT(98RAN# + 1) will generate random numbers from 1 to 98 in the Casio graphics calculator. If you forget the +1 in the formula, the number 98 won't be generated - sad.
On the graphics calculator go into run mode and select options. In the submenu select NUM and click on INT. Put in an open bracket followed with '98'. Go into the PROB submenu and click on RAN#. Finish by adding the + 1 and closing bracket and there you go. If you have the old FX 82 you can use the same formula but without the 'INT' bit. So that would be 98Ran#+1.
ACTIVITY
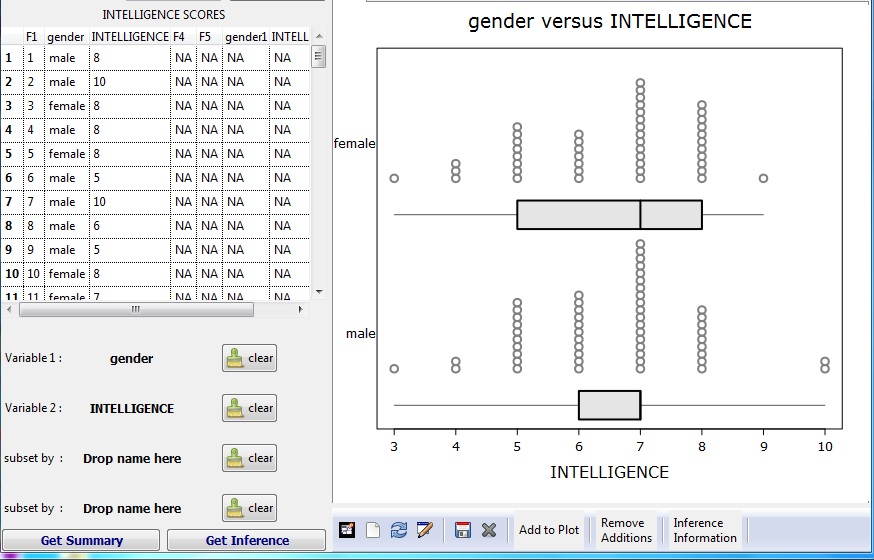
Take 20 random samples from each gender and create your 5 number summaries. Sketch two box plots. The image below shows the actual population data where both medians are the same. So the 1/3 rule indicates that the medians are too close together to make a call. However your boxplot might give a different picture. Notice the male median is the same as its upper quartile (the top of the box). Some of you got similar 'strange' graphs in class. This is one reason why taking small samples is not a good idea - really weird things can happen.
| intelligence_scores.xlsx |