
kiwi investigation
Problem:
I recently watched the discovery channel about Kiwis birds. I want to learn a little more about our national bird.
The population is the sample of 700 kiwi from the NZGrapher database sourced from www.kiwisforkiwi.org.
My question is ‘I wonder if there is a relationship between the height and the weight of NZ Kiwi birds from the sample of data from NZGrapher. I think the taller kiwis will probably weigh more than the shorter ones.
Plan:
The Explanatory (independent) variable is the height of the Kiwi birds in cm. The response (dependent) variable is the weight of the Kiwi bird in kgs. I chose the explanatory variable because I think this will have the strongest effect on the relationship in the graph.
The Explanatory (independent) variable is the height of the Kiwi birds in cm. The response (dependent) variable is the weight of the Kiwi bird in kgs. I chose the explanatory variable because I think this will have the strongest effect on the relationship in the graph.
Analysis:
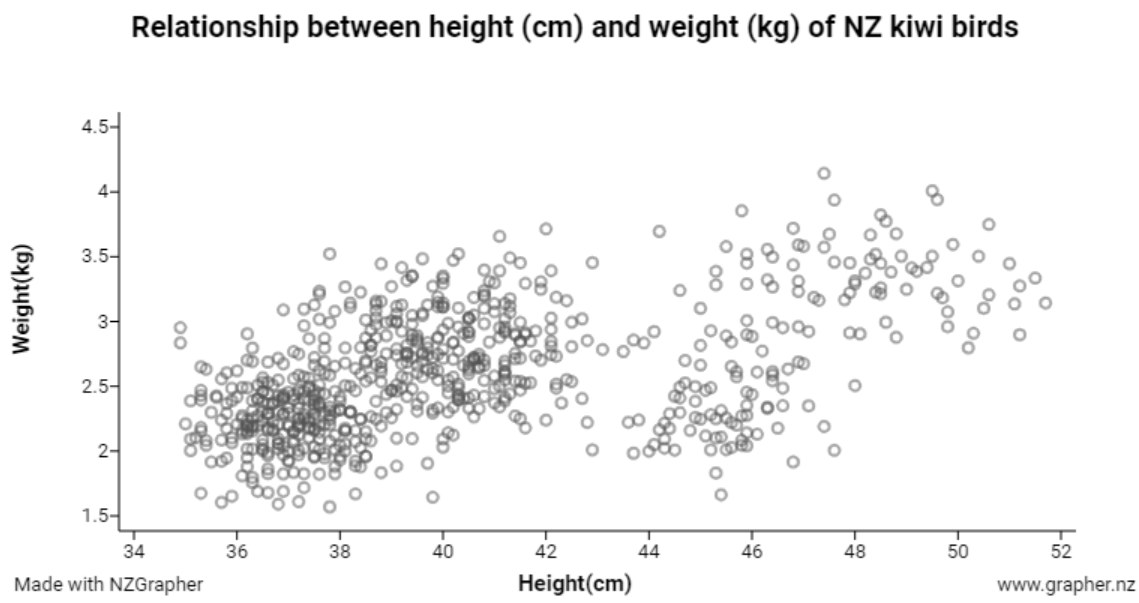
Referring to the graph above there appears to be a positive linear trend. Because the trend appears to be linear, I will fit a linear regression line to investigate this further. This means that taller Kiwi weigh more.
Referring to the graph above there appears to be a positive linear trend. Because the trend appears to be linear, I will fit a linear regression line to investigate this further. This means that taller Kiwi weigh more.
Trend:
Looking at the regression line I notice that the data points form a linear band of data points.
Many birds of the same height seem to have different weights. This means there is a lot of variation within the sample from NZGrapher.
Extension:
The trend is linear because I can't see any other shape in the data such a curve. This makes sense because the birds grow in a linear proportion, their weight increases linearly with height. Otherwise the birds would put on weight rapidly as they got taller.
Association:
I can see that the association is positive because as the heights of the kiwi increase, the weight of the kiwi also tend to increase. (Positive since the line slopes upwards from left to right).
So the taller the kiwi, the heavier they are.
Extension:
This makes sense, since living things tend to get larger or heavier as they get taller. I see this occurring with farm animals and so I don't think kiwi would be any different. The rates of growth might be different for different species but in the end tall things are bigger.
Strength:
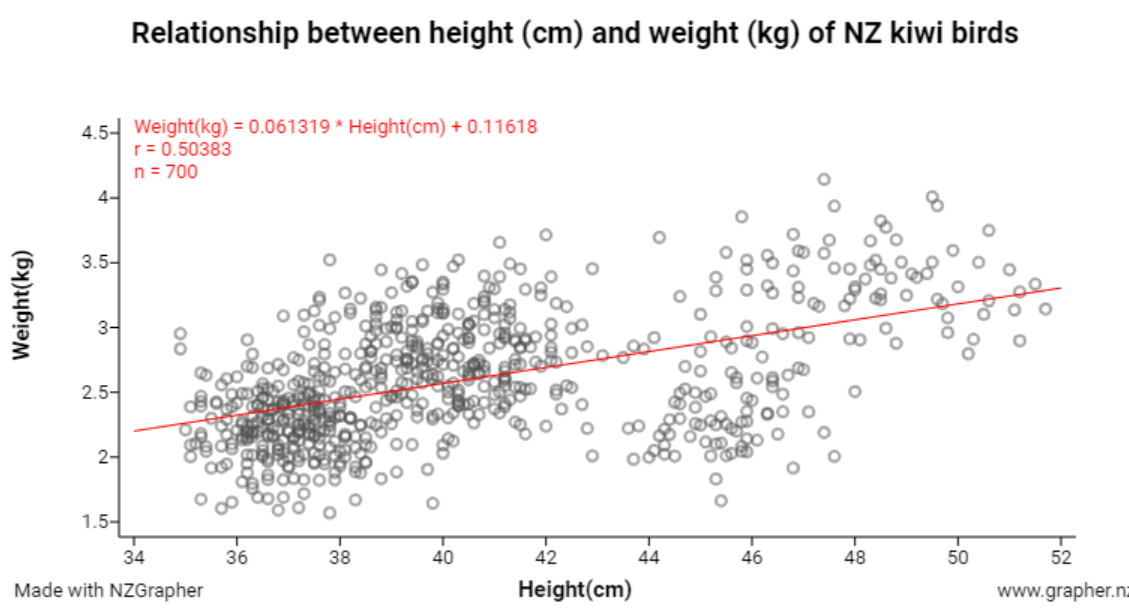
The strength of the relationship is moderate since the data points are reasonably scattered above and below the trend line. The r value or correlation coefficient at 0.5 also suggest the relationship is not a strong one.
Extension:
I notice that when the kiwi bird data set is investigated using gender as a highlight, it can be seen that male and female birds are equally spread above and below. This is because of the variation amongst the data set which also includes the three main species of kiwi. It it the Great Spotted kiwi data set that extends the trend line of the graph along independent variable axis (height). The male and female samples cause the data to spread along the dependent axis (weight).
Groups:
Looking at the graph, I notice that there are two large groups of data equally distributed above and below the trend line. The first group identifies smaller kiwi from about 35cm to about 43cm. The second group identifies kiwi from about 44cm to about 52cm.
Extension:
Looking at the graph in NZGrapher I noticed the two groups are part of different locations in New Zealand. The heavier birds being the great spotted kiwi and the other two species occupy the smaller group. Also referring to the graph and its attached data, the great spotted kiwi are located in East Canterbury and Central Westland. This explains why the data is grouped at the top of the graph, the heavier birds live in those two main locations.
Unusual values:
I don't see anything unusual in the data set in terms of outliers but many kiwi of the same height have different weights. So there is a lot of variety in the data.
Extension ideas:
Looking at the graph I can see that one sample weighs more than all other kiwi. Referring to NZGrapher this particular bird is a female great spotted kiwi weighing 4.143 kg. This bird could be an older one or carrying an egg. Kiwi lay really big eggs! Looking at a graph of species in the height weight graph, the Great Spotted kiwi appears to be generally larger than the other species like the North Island brown kiwi and the Southern Tokoeka. Age is another factor that might account for smaller birds of each gender as younger birds would be lighter than older birds, heavier.
Scatter:
The scatter is consistent across the data set in the graph. Some slight scattering of the data points is visible at the far right end of the graph for where the birds are tallest. Here the variation with the birds' weights is greatest.
The scatter is consistent across the data set in the graph. Some slight scattering of the data points is visible at the far right end of the graph for where the birds are tallest. Here the variation with the birds' weights is greatest.
Regression Line
The linear regression line gives us the average increase over the whole graph. The equation for the regression line:
Weight (kg) = 0.061319 x height (cm) + 0.11618
This means that for each increase in height of 1cm, the weight of a kiwi approximately increases by about 0.061319 kg or about 61 grams.
Extension:
Confidence in the Regression line
Extension:
Based on my linear regression line I would predict that a bird with a height of 50cm would weigh about:
W = 0.061319 x 50 + 0.11618 = 3.18kg
There are a few data points above and below this value so I am confident the prediction is reliable.
Conclusion:
Based on the information I have gathered I conclude that kiwi which are taller, generally will weigh more than kiwi which are shorter. This is shown on the graphs showing a positive linear relationship between the height and weight of kiwi from the NZGrapher data base of 700 birds.
Extension:
Visually, the scatter along the trend line suggests a moderate relationship which is supported by the r correlation coefficient of 0.50383. So height tends to influenced the weight of the birds. But by I also discovered another factor, gender affecting the weight of the birds. The trend also follows through the different species in the data set and the relationship still holds, taller kiwi are heavier.
This model and investigation could be useful for the department of conservation, bird rescue and others with a genuine interest in our national bird.
I could improve my report findings by investigating in more detail the affects of the relationship by taking into consideration gender, the three species that make up the majority of birds in the data set and location to see if the relationship holds true, though I an reasonably confident the trend will hold.
There are more than 3 species of kiwi in NZ. For example, the little brown kiwi is not included and there may be other species too. So the sample is not fully representative of the total kiwi population in NZ.
The sample population is 700 out of an estimated population of 76000 birds, about 1%, therefore, the sample could be considered small. I could investigate a much larger selection of kiwi to see if the relationship I have discovered here is similar or different. However, if I had of taken a different sample from the population I might get slightly different results but I would expect the trend to be similar. I can conclude that taller kiwi weigh more than shorter kiwi in the data set for NZ Kiwi. I am reasonably confident that this relationship will extend to the greater population distribution of kiwi in NZ.
