how to draw the graph
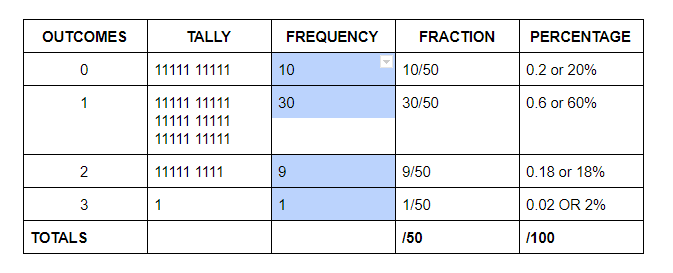
1) Copy the frequency column from your frequency chart
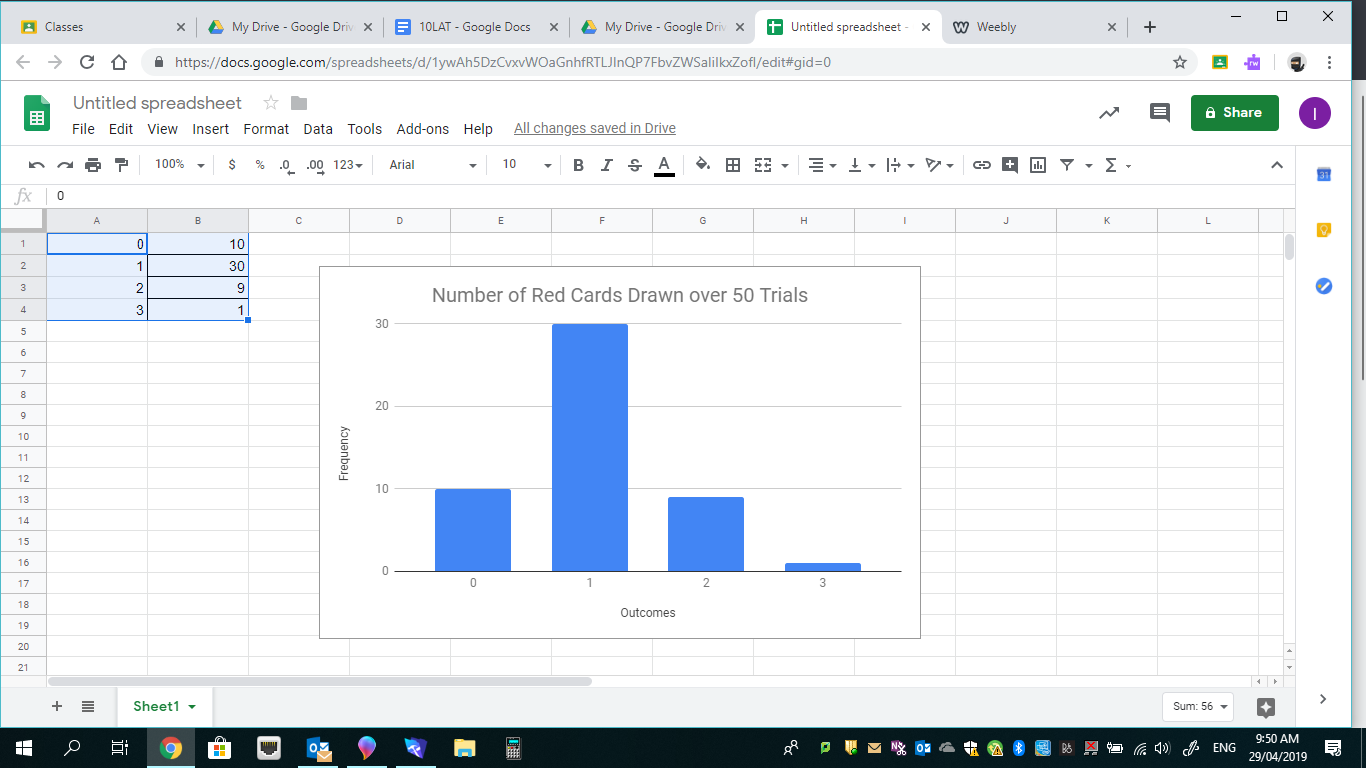
2) Create a google sheet and paste into it the data from your frequency chart. Notice the extra column inserted on the left for the outcomes of 0,1,2 and 3.
3) Click on Insert chart
4) Add titles and labeling by double clicking on the chart
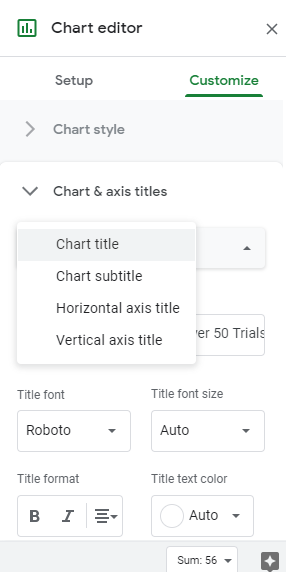
5) Select chart and axis titles, see examples below.
2) Create a google sheet and paste into it the data from your frequency chart. Notice the extra column inserted on the left for the outcomes of 0,1,2 and 3.
3) Click on Insert chart
4) Add titles and labeling by double clicking on the chart
5) Select chart and axis titles, see examples below.
copy the data
paste into google sheet
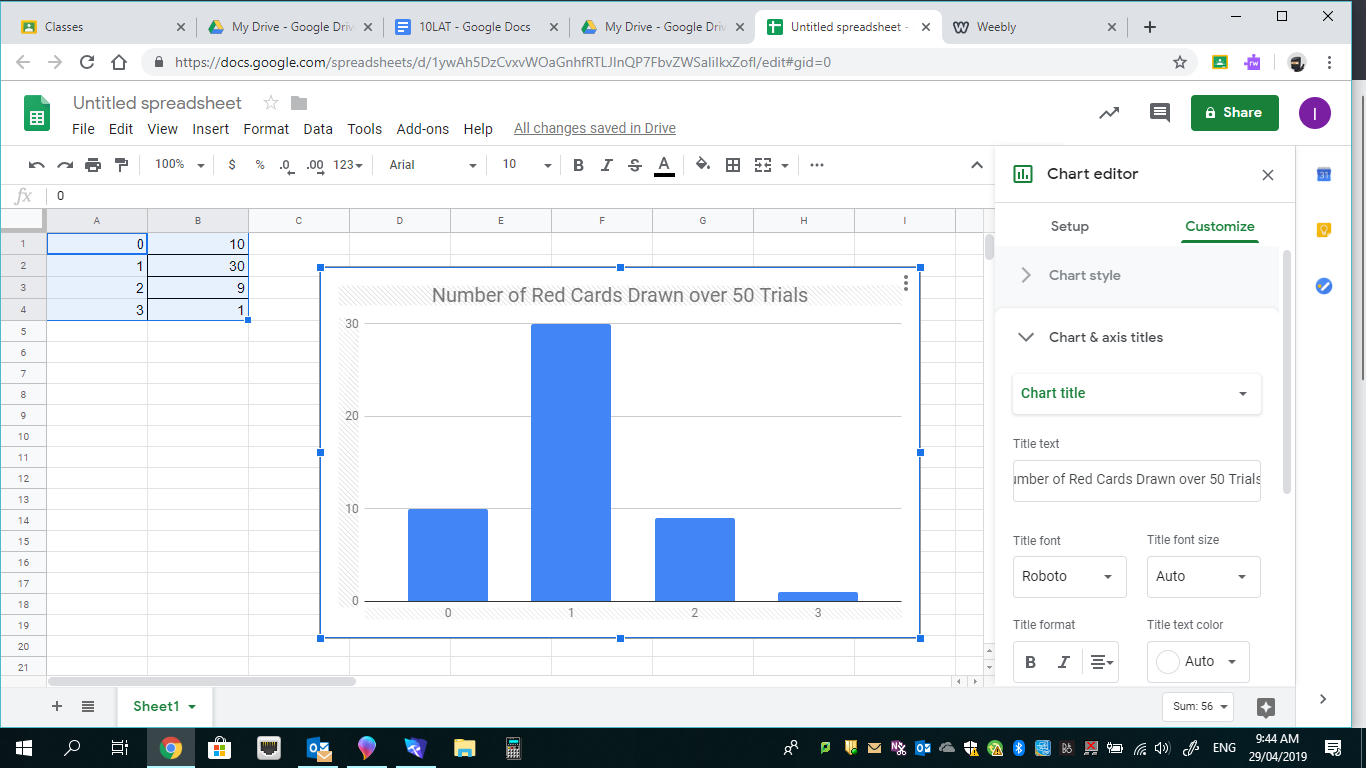
Chart title and labels detail
final chart