SAMPLING VARIABILITY AND SAMPLE SIZE
You probably know by now that everyone in class has obtained a different sample during the sampling activity - that's what probability does. So sampling variability means that our samples vary from one another although they are similar, but still different! Each sample will have a similar yet different 5 number summary.
To Achieve you MUST discuss sample variability, including the variability of the population estimates. So you would say something like "Another sample will give different medians and informal confidence intervals". That latter part of the statement referring to an informal confidence interval is a technique used to make the call in the conclusion of our PPDAC report. It replaces the 1/3 rule that we used in Level1 stats. It uses a formula and will be discussed later.
The size of the sample you use will also influence the inference. Have a look at one of Chris Wild's box plot slideshows below. The main point here is that by taking a larger sample, we reduce variation in our sample calculations. Some variation will still occur in large samples so it won't go away completely. The larger the sample, the more accurate our sample parameters will reflect the true median (which we can't see). Chris Wild lectured at Auckland University and was instrumental in teaching teachers and bringing the latest ideas and tools into the classroom.
The following video expresses the same concepts in a slightly different manner.
Practice Sampling Data Activity #2
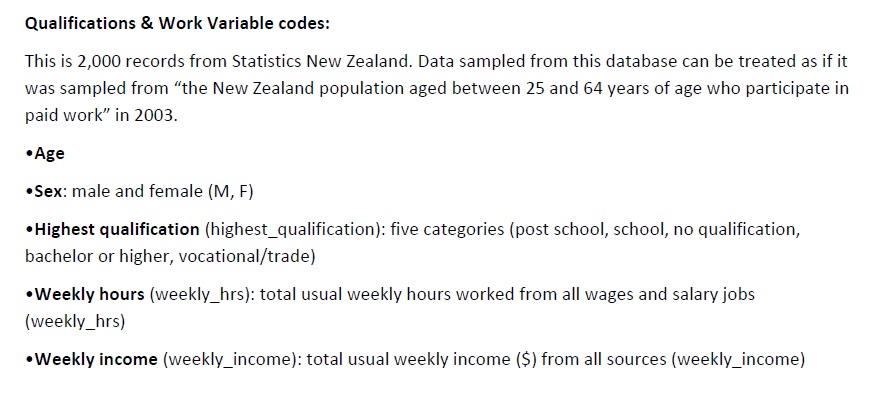
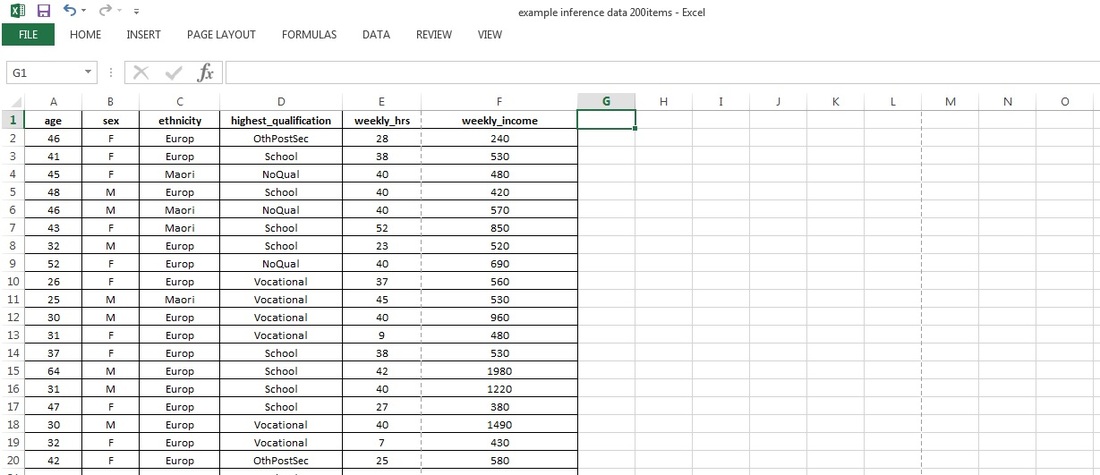
This time you need to come up with an investigative question before sampling the data. You can then take 50 samples from each of the genders male and female, produce 5 number summaries and sketch boxplots. Comment on sampling variability and sample size, its importance in a statistical inference. You can download the data and variables sheet here also.
| practice_data_variables.pdf |
| example_inference_data_200items.xlsx |
Here is a preview of both the variable data sheet which tells you what stuff means and the EXCEL file that contains the data which you have to choose from.