
statistics example
Kiwi
problem:
It is known from research that some female members of a species are larger than the male. This occurs in some rodents, insects, fish and birds. It has been noticed by scientists that some male birds show 'motherly' characteristics as a reason why this might happen.
Question: I wonder if the median weight (kg) of female kiwi from the NZGrapher database is higher than the median weight (kg) of male kiwi from the NZGrapher database.
Plan:
I will be using information from the kiwi data set provided from NZGrapher. I will take a random sample of 100 kiwi, (50 male and 50 female) provided by NZGrapher. As long as my sample is a reasonable size, I can be confident that my sample of 100 kiwi will represent the population I am investigating from the NZGrapher database.
data:
analysis:
Initial Observations
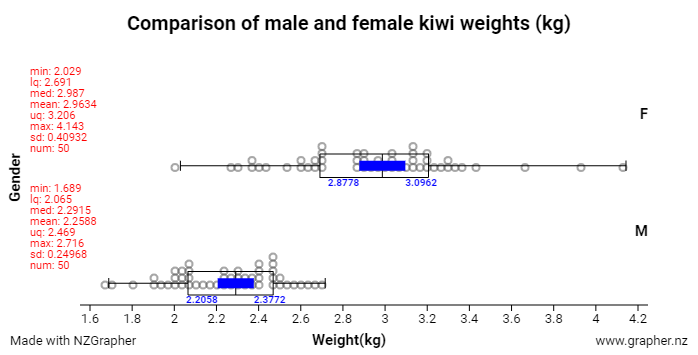
My initial impression of these two samples is that there is a considerable difference in the median weights between female and male kiwi from the NZGrapher sample representing the population of kiwi in New Zealand, indicating that female kiwi are heavier than the male kiwi. The dot plot for female kiwi has a much wider spread than the dot plot for male kiwi. However, both female and male kiwi graphs follow a normal distribution curve (uni-modal or symmetrical), with the male dot plot being a little left skewed and the female dot plot slightly right skewed. A normal distribution means that there is a cluster of data points around the middle with equal distribution either side of the median weight. There are some small gaps in the dot plots of both female and male graphs where for some reason no kiwi were caught and measured at those weights. This could be because the kiwi of a particular age were not present assuming same age same weight or simply could be caught in another sample. Fish are known to swim in small schools where each fish is of a similar size though I don't think kiwi roam together in the same way.
Central Tendency:
Looking at my graph and data I can see that the median weight for female kiwi is 2.987 kg and the median weight for male kiwi is 2.2915 kg, a difference of 0.6955 kg. Based on this sample, female kiwi are likely to be heavier than male kiwi back in the kiwi population data set given by NZGrapher. This supports some of my research that suggest the eggs that female carry may exceed 20% of total bird weight. This also happens in other birds and fish where the females are also larger or longer in length on average.
Spread:
The IQR (middle 50%) for female kiwi weight is 0.515 kg whereas the IQR for male kiwi weight is 0.404 kg. This is why the 'box' for female kiwi is wider. This indicates that there is more variation in the weights of female kiwi. Overall visually from the dot plots the female kiwi seem to be more spread out than the male kiwi with some of the data points extending out to just under 4.2 kg. From this sample I would expect a similar distribution of data points in the population data set from
NZGrapher.
According to www.bio.libretexts.org variation is a result of genetics within the species and wider variation can be an advantage allowing the birds to adapt to the environment to allow the population to survive better. Geographic isolation can also affect variation and can favor both male and female members of the species. In some fish, male and females live apart from each other so that the females may be exposed to areas of greater nutrients while the males take their chances hunting for their food chasing prey. Other reasons may include the different reproductive systems and roles played in the population leading not just to larger birds but faster growth rates of female birds.
Overlap:
The middle 50% (IQR) for female kiwi weights are between 2.691 kg and 3.206 kg, whereas the middle 50% (IQR) for male kiwi weights are between 2.065 kg and 2.469 kg. There is no overlap of the middle 50% (IQR's) for female and male kiwi.
Shift:
The box (middle 50%) for the female kiwi is further shifted to the right of the male box (middle 50%). The lower quartile for female kiwi weights (2.691 kg) is higher than the upper quartile for the male kiwi weights (2.469 kg). This also indicates there is no overlap of the middle 50% (IQR) for male and female kiwi.
Shape:
The distribution of the weights of female and male kiwi are both relatively symmetrical with the with the LQ and UQ for female weights (2.691 kg and 3.206 kg, respectively) about 300 g from the median of 3 kg. The male graph shows some left skewing of the data and female, right skewing of the kiwi data. The LQ and UQ for male weights (2.065 kg and 2.469 kg respectively) about 200 g from the median of about 2.3 kg.
I think the distributions of weights of female kiwi would also be nearly symmetrical in the population of kiwi in the NZGrapher data set and the male kiwi data slightly left skewed.
Special features:
Looking at the graphs I can see that the female kiwi have one sample that weighs more than all other kiwi. Referring to NZGrapher this particular bird is a great spotted kiwi weighing 4.143 kg. This bird could be an older one or carrying an egg which can account for up to 20% of a kiwi's body weight. It could also have been kept in captivity and 'fattened up' before its release. This species of kiwi is generally larger than the other species like the North Island brown kiwi and the Southern Tokoeka. Age is another factor that might account for smaller birds of each gender as younger birds would be lighter than older birds, heavier.
Inference:
I can infer that the population medians will be inside the informal confidence intervals. I am pretty sure that the median weight of female kiwi from the database is between approximately 2.88 kg and 3.10 kg and the median weight for male kiwi is between 2.21 kg and 2.38 kg. The confidence interval for female kiwi is approx. 0.2 kg and for the male, approx 0.17 kg.
Back in the population of kiwi I would also expect similar results to the above. There is no overlap of the confidence intervals for female kiwi (0.2 kg) and male kiwi (0.17 kg) and 25% of the female data is higher than 75% of the male data. Therefore I can infer that female kiwi weigh more than male kiwi in the population database from NZGrapher.
Conclusion:
Based on my sample I am reasonably confident that back in the population of kiwi in the NZGrapher data set that the median weight of female kiwi will be more than the median weight of male kiwi. The confidence interval tells us that the true female median weight is likely to be between 2.8778 kg and 3.0962 kg in the population of female kiwi. Likewise, the confidence interval tells us that the true male median weight is likely to be between 2.2058 kg and 2.3772 kg in the population of female kiwi. Since there is no overlap of the confidence intervals I can make the call that female kiwi are likely to be heavier than male kiwi in the population data set from NZGrapher.
If I took another random sample of the same size I would also expect to get similar but different summary statistics since random samples will provide a good representation of the population resulting in the same inference and conclusion.
[Note on the sampling variability:
estimates only approximate the population parameter, and they vary from one sample to another. ... If this variability is small (i.e. the sample median doesn't change much from one sample to another) then that estimate is probably very accurate.]
Increasing the sample size would provide a more accurate (closer to the true median value) representation of the population provided the sample was random. This is because as the sample size is increased the confidence interval reduces in width as it approaches the true median value. However, it is often too costly or too difficult to carry out large scale sampling in real life situations.
This report might be useful for other students or people interested in the topic or related material including fish and insects.
