
mr dee's math class
Problem:
I wonder if boys tend to be taller than the girls in Mr Dee’s math class.
Plan:
I will investigate this using a sample of 56 students (originally 30 students but I checked the data file and it's 56!) I will use this data to answer my investigative question.
I will then use NZGrapher to make a comparative box and whisker plot combined with a dot plot. I will also produce a summary of statistics for my sample.
Analysis
Central Tendency:
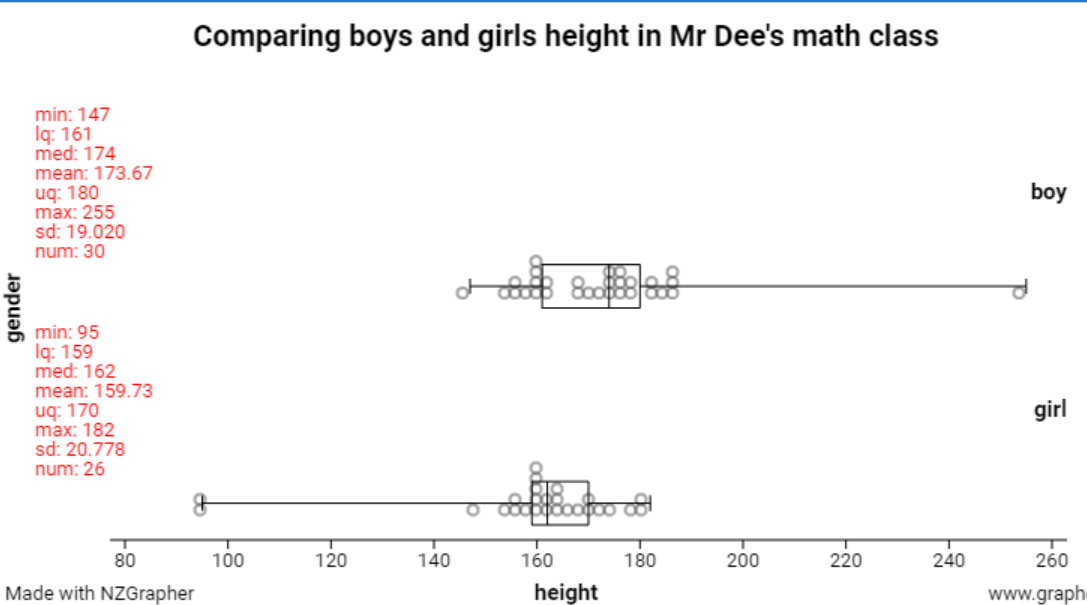
The median height of boys is 174cm. This is higher than the median height of girls in the class which are 162cm. This is indicated by the black line in the middle of the boxes.
Spread:
The IQR (middle 50%) for boys is 180 - 161 = 19cm, whereas the IQR (middle 50% ) for girls is 170 - 159 = 11cm. This indicates that there is more variation in the heights of boys. Overall visually looking at the dot plot, the boys are more spread our than the girls.
Conclusion:
The graph shows that the median heights for boys is greater than the median height for girls in Mr Dee’s math class. The dbm/ovs (distance between the median divided by overall visual spread) ratio is 12/21 = 0.57 and since this is greater than 1/3, I can make the call that the boys tend to be taller than the girls in their math class. This is confirmed by the median values in the summary statistics above. The median height for the boys is 174cm and the median height for the girls is 162cm.
Central Tendency:
The median height of boys is 174cm. This is higher than the median height of girls in the class which are 162cm. This is indicated by the black line in the middle of the boxes.
Spread:
The IQR (middle 50%) for boys is 180 - 161 = 19cm, whereas the IQR (middle 50% ) for girls is 170 - 159 = 11cm. This indicates that there is more variation in the heights of boys. Overall visually looking at the dot plot, the boys are more spread our than the girls.
Conclusion:
The graph shows that the median heights for boys is greater than the median height for girls in Mr Dee’s math class. The dbm/ovs (distance between the median divided by overall visual spread) ratio is 12/21 = 0.57 and since this is greater than 1/3, I can make the call that the boys tend to be taller than the girls in their math class. This is confirmed by the median values in the summary statistics above. The median height for the boys is 174cm and the median height for the girls is 162cm.
