
PROBABILITY EXAMPLE 2
PROBLEM
I wonder how likely it is that I draw out 3 red cards from a pack of 14 cards? I think it is unlikely, perhaps I might get it once or twice. [If there were 10 red cards in your pack or even more, would you really be that surprised at drawing 3 red cards from it? This means you have to be a bit careful when you make this prediction at Merit and Excellence level.]
PLAN
I have 14 cards in my pack, 6 red and 8 black [This is the similar to Example 1 but there are 14 cards instead of 7 (twice as many)]. I will shuffle the cards face down and turn up three cards at random. I will record the results in a table. I will then return the cards to the pack and reshuffle them. I will repeat this process 50 times. I will then use the data to draw a bar chart. The possible outcomes are:
0 red cards
1 red card
2 red cards
3 red cards
0 red cards
1 red card
2 red cards
3 red cards
DATA
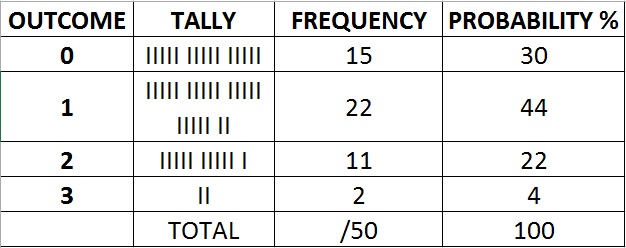
ANALYSIS
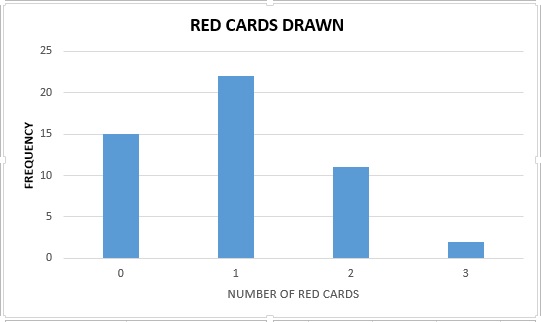
I notice that the most frequent result was getting 1 red card which was 44% of the time followed by no red cards 30% of the time. I got 2 red cards 22% of the time and 3 red cards only 4% of the time. The graph is not symmetrical but skewed to the right. This is because the most common results are no red cards and 1 red card.
CONCLUSION
From my experiment I got 3 red cards only 4% of the time. I conclude that in the long run I am likely to get similar results, that is 1 red card the most. This would be followed by no red cards, then 2 red cards and finally the least likely, getting 3 red cards.
