
BIVARIATE DIAMONDS
updated 10th March 2020
problem
I am interested in buying a diamond ring. Diamonds are a symbol of wealth and power, being naturally made from compressed carbon. Diamonds are a popular gem used in jewelry but also find applications in industry. I am aware that the larger a diamond is the higher the price they sell for. Although my research into diamonds confirms this, I have discovered that there are other factors affecting the price of a diamond using the 4C's system. This being a measure of carat (weight), clarity, colour and cut. [insert ref here]. Over the years the price of diamonds has increased due to market demand [ref insert].
I want to find out if there is a direct relationship between the weight of a diamond and its price. Source of my data used in this investigation is based out of Singapore and taken from NZGrapher. From my understanding, a 0.5 carat diamond should cost less than say a 1 carat diamond.
My question is: What is the relationship between the carat of a diamond and its price?
plan
identify variables
The explanatory (independent) variable is the weight of a diamond in carats (1 carat = 0.02 grams). The response (dependent) variable is price of the diamond. Price is measured in US dollars.
I chose diamond weight (carat) for the explanatory variable because I think that out of all the variables this will have the strongest influence and most direct relationship with the price of diamonds. I have discovered that large diamonds command high prices. [insert a reference here in support].
I chose diamond weight (carat) for the explanatory variable because I think that out of all the variables this will have the strongest influence and most direct relationship with the price of diamonds. I have discovered that large diamonds command high prices. [insert a reference here in support].
data
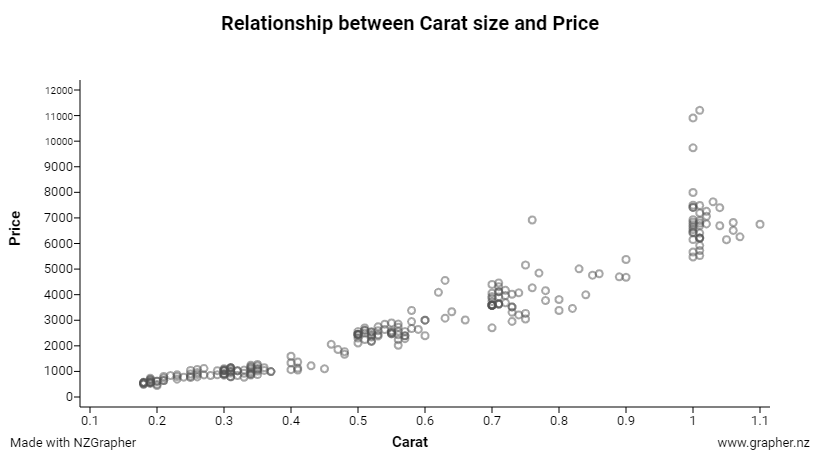
analysis
Referring to the graph above there appears to be a positive linear trend as the scatter appears at the bottom left and gradually increases to the top right corner. Because the trend appears to be linear, I will fit a linear regression line to investigate this further. This means that a larger carat diamond tends to have a larger price tag. However, according to www.diamondsareforever.com the price of diamonds tends to follow a more exponential relationship. So I will also explore other models aside from the linear trend. This means that a diamond with twice the carat weight could cost more than twice the price! I also notice a slight curve in the data along the top right hand part of the graph further supporting a non-linear model.
class notes - analysis using tASGUS
trend - linear or non-linear
association - positive or negative
strength - weak, moderate or strong
groups - or clusters with possible reasons
unusual data - anything worth noting
scatter - is it even (consistent) or changing
trend
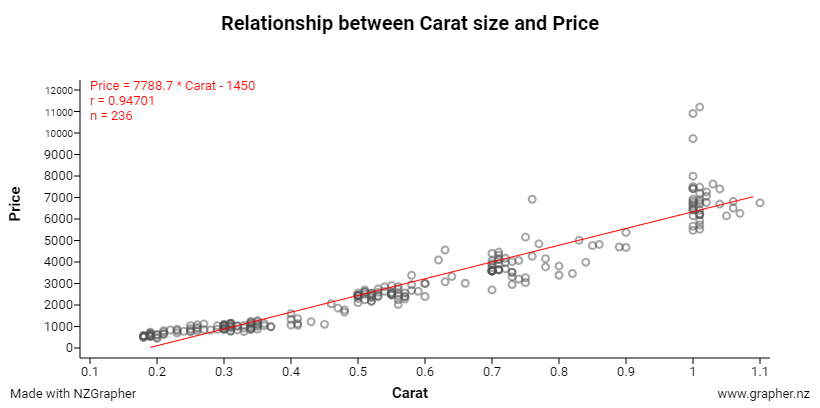
looking at the linear regression line I notice that the data at the lower left of the graph sits above the regression line below about 0.3 carats. Most of the data points are below the regression line between about 0.5 and 0.9 carats. Finally around the 1 carat weight some data points return above the regression line. This suggests that another model may be more appropriate. The linear regression line is a reasonable representation of the model but only for some of the data. I noticed that a quadratic and exponential model fits the data pattern much better from exploring these functions in NZGrapher, (see graph below).
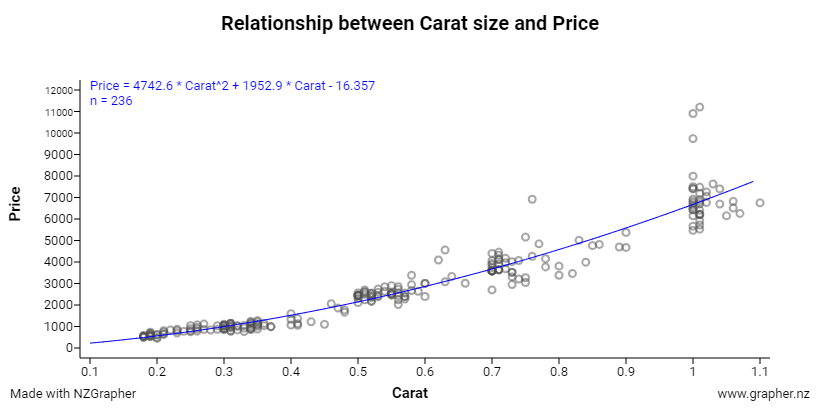
I think the new quadratic trend line is a relatively good model for most of the data points due to the slight curvature of the data set. It can be seen that there is a more even split of data points above and below the regression line.[www.diamondsovergold states good quality diamonds in the 1 carat category can cost up to 4 times the price of a 0.5 carat diamond.]
Association
I can see that the association is positive because as the diamonds increase in weight, the price of the diamonds also increases. That is, the heavier the diamond the higher the price. This is evident for both linear and quadratic regression line types.
strength
The strength of the relationship is moderate and approximately quadratic as I can see that most of the points form a reasonably consistent pattern up to about 0.6 carats in weight. From about 0.6 carats and above, the scatter is further away from the regression line.
groups or clusters
I notice that there are groups or clusters of data points along the regression line. This occurs especially around 0.2 to 0.4 carats, from 0.5 to 0.6 carats and significantly around 1 carat in diamond weight. This should not be surprising since 0.5 and 1 carat diamonds are very popular for young couples or those purchasing their first diamond engagement ring. Michael Hill, a popular diamond ring franchise found throughout New Zealand sells 0.5 and 1 carat solitaire diamond rings for around NZ$1500. Many of the smaller diamond sizes are sold as cluster sets that might weigh 0.5 or 1 carat in total. Small diamonds are also sold adorning watches and cheaper rings and bracelets. (sources - Rolex watches, Pandora Jewelry)
unusual data
There are approximately 6 or 7 diamonds whose data points float above the regression line. One diamond weighs 0.75 carats with a price of nearly $7000. 4 of the 1 carat diamonds are priced from $8000 to over $11000. These diamonds have maximum clarity and are also sold by LAB 1 in Singapore. According to www.diamondspro.com, the fewer inclusions and blemishes the diamond has, the better the clarity grade. While the clarity can significantly impact a diamond's value (it's one of the most important 4 C's), imperfections typically can't be recognized by the naked or unaided eye.
scatter
For the quadratic model, the scatter appears to be reasonably consistent for carat weights below about 0.6 carats. But above 0.6 carats it tends to fan out. More noticeable is where this happens around the 1 carat diamond weight. This is because there are a greater variety of diamonds in the 1 carat weight range whose price probably depends on other factors which I will explore shortly.
Causation
Is the weight of the diamond directly affecting the value of the diamond? Could there be other factors involved. I initially stated that there appears to be a positive, non-linear moderate relationship between the weight of a diamond (carats) and its price. That is, larger diamonds tend to cost more than smaller ones. Large diamonds are the stuff of popular diamond heist movies and TV shows such as Oceans Eight and A Fish Called Wanda. (www.MDBMostPopularDiamondHeistMovies.com)
However, the data points around 1 carat diamond weight suggest that there is a considerable range of prices for such a large and popular diamond weight. This is quite helpful for the consumer because there is an affordable diamond ring for "everyone" it seems. So there must be other factors affecting the price of a diamond besides weight alone.
According to www.villagegoldsmiths.com, the other factors affecting price are, cut, clarity and colour. Another factor involved with this data set is the fact they are produced by two laboratories based in Singapore.
interpretation of predictions using the linear regression line
The linear regression line gives us the average increase over the whole graph.
The equation for the regression line:
Price = 7788.7*carat - 1450
This means that for each increase in carat, the price approximately increases by about $7800.
predictions using the linear regression line
Price = 7788.7*carat - 1450
Based on my linear regression line I would predict that a diamond that has a weight of 0.5 carats would cost about $2444.35. I am confident in this prediction because there are a number of data points around this value.
Choosing another point higher up the scale for a diamond weight of 1 carat. Based on my regression line I would predict that a 1 carat diamond would cost about $6338.70. I am not confident in this prediction because there are a large number of 1 carat diamonds that vary considerably in price as discussed in the causation section.
prediction confidence
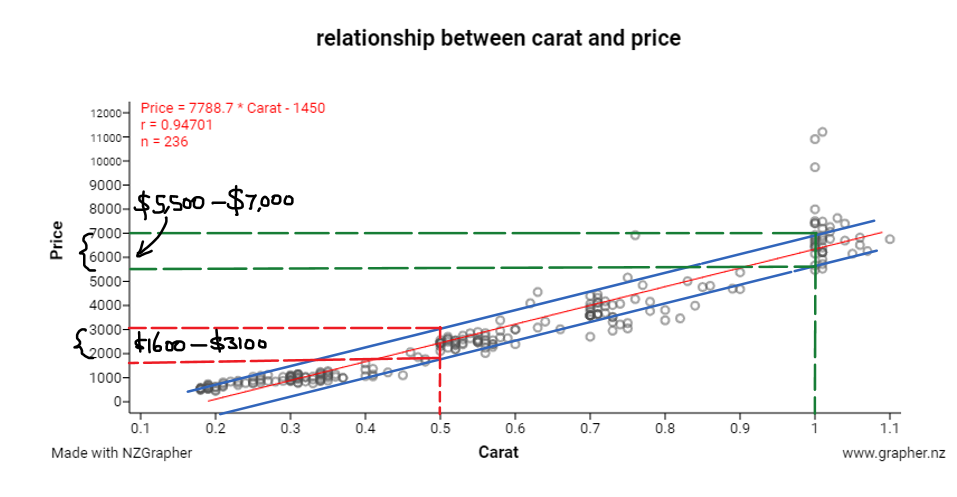
If we look at this graph we can see that most of the points are between the dotted lines. If we go back to one of the predictions we did earlier...Based on my regression line I would predict that a 1 carat diamond would cost about $6338.70. I was not confident in this prediction because there were a large number of 1 carat diamonds that varied considerably in price as discussed in the causation section. However, I can be confident that the cost of a 1 carat diamond would cost between $5500 and $7000. This is a bandwidth of $1500.
residuals
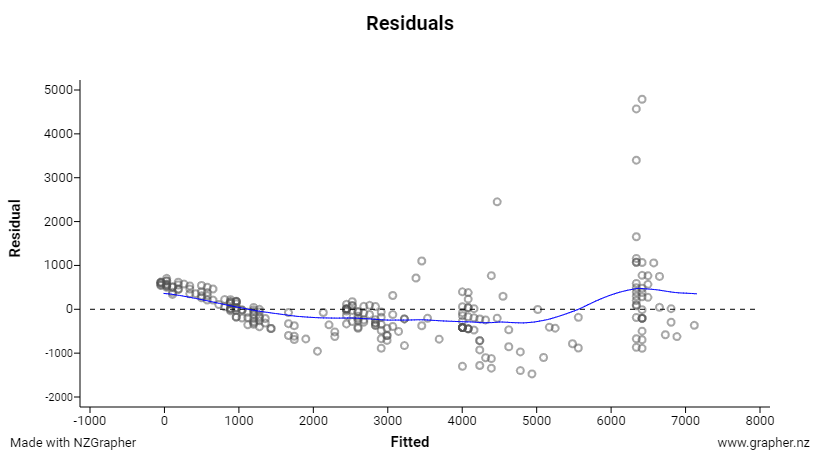
The residuals plot is a measure of how good the model is that NZGrapher creates. The x axis is now the price or response variable. The y axis gives the error value which is how far away the data points are from the regression line in the graph model that NZGrapher creates. The dotted line at zero is the predicted value. If the model was perfect all the dots would lie on the dotted line.
However, it can be seen that many of the data points at the start are above the line, then they dip below the line at about $1000 before rising above the line around $5500. So the price of the diamonds would be considered to be accurate where the weighted average ( blue line) crosses the residual or "0" line at about $1000 and about $5500. Looking at my residuals I think that the price of the 0.5 carat diamond I predicted earlier of $2444.35 will not be the same based on the residuals graph.The original prediction for a 0.5 carat diamond was $2444.35. It can be seen that at this point looking at the fitted scale that most of the data points are below the dotted line. This is also shown in the blue weighted line. So the predicted value was probably an over estimate (too high). So the real price could be about $500 less.
The original prediction for a 1 carat diamond was $6338.70. It can be seen that at this point looking at the fitted scale that there is a wide range of data points above and below the dotted line. Here, the predicted value could be about $1000 lower or $5000 higher. This was reflected in the low confidence discussed earlier.
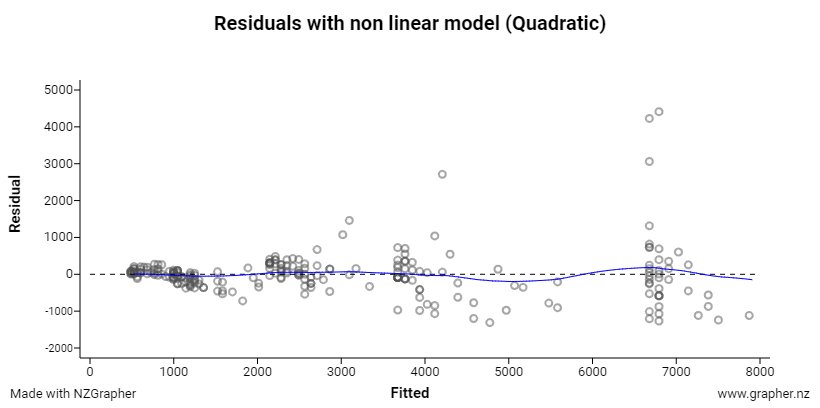
An alternative model is a non linear model. In this case I used a quadratic model to see if it better fits the data. It can be seen that the weighted average follows more closely along the zero line. Remember, that if all the data points were on the line, the model would fit perfectly. I think compared with the linear model, the data is a better fit. Under the quadratic model, a 0.5 carat diamond would cost about $(4742.6 x 0.5^2+1952.9 x 0.5 -16.357) = $2145.74
Looking at the residuals graph we can see that the weighted average line is only slightly above zero, so my estimate might be about $100 too low. So the real price could be around $2045.
Looking at the residuals graph we can see that the weighted average line is only slightly above zero, so my estimate might be about $100 too low. So the real price could be around $2045.
conclusion
Based on the information I have gathered I conclude that diamonds which weigh more (more carats) generally will command higher prices.This is shown on the graphs showing a positive linear relationship between carat and price of diamonds. The graph was then replaced with a better fitting model expressing the relationship as a positive non linear quadratic relationship between the weight of a diamond in carats and its price in US$1000.
The r value of 0.94701 suggests a strong relationship should exist between carat size and price so that the weight of the diamond is solely responsible for its price. But by I discovered other factors such as colour and clarity affecting the price of a diamond, the relationship overall is more of a moderate one.
This model and investigation could be useful for Jewelers and Gem appraisals so they know what to look for when evaluating a diamond.
I could improve my report findings by further investigating colour and cut to see how much they influence the price of the diamond.
The data selected for the report only comes from 2 sources in Singapore. The sample population is therefore quite small. I could investigate a much larger selection of diamonds to see if the relationship I have discovered here is similar or different.
references
www.smartypantsdiamonds.com
www.hardrocks.com
etc
www.hardrocks.com
etc
