Your report structure
You can use this summary of the main points to structure your report.
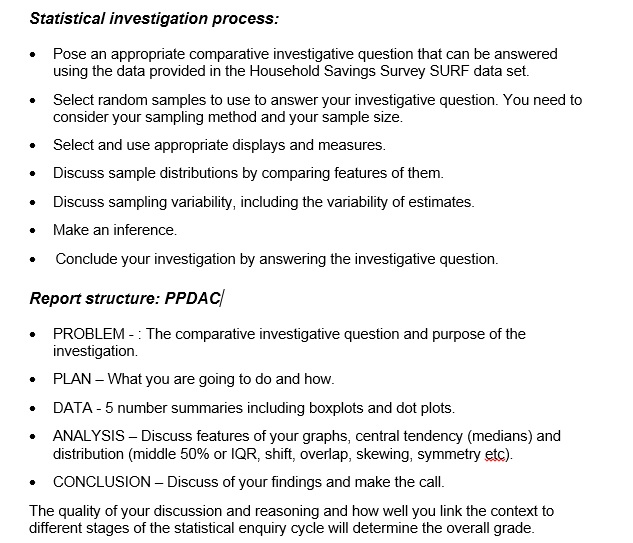
PRACTICE ASSESSMENT
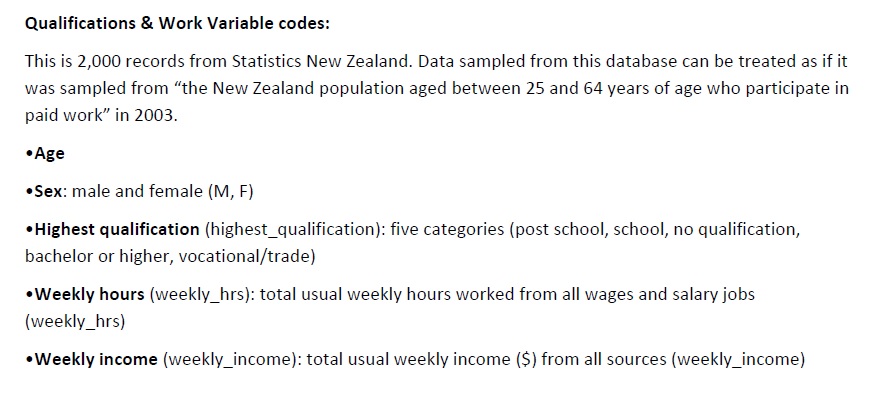
Using the statistical inquiry cycle, write an investigative report in the form of PPDAC. Study the data sheet provided which contains 200 records of males and females. The diagram below explains the variables used. The list has been cut back from 2000 to 200 for convenience. I suggest you investigate and compare female and male weekly income or weekly hours worked. Write a comparative investigative question and based on your samples and graphs answer the question by making the call, if you can.
An example of a comparative investigative question might be,
PROBLEM: "I wonder if the median weekly income for males is higher than the median weekly income for females back in the population. From what I have learned from the media I believe the median income for males may be more than the median for females".
The table below explains the data variables in your 'population' database of 200 (not 2000!)
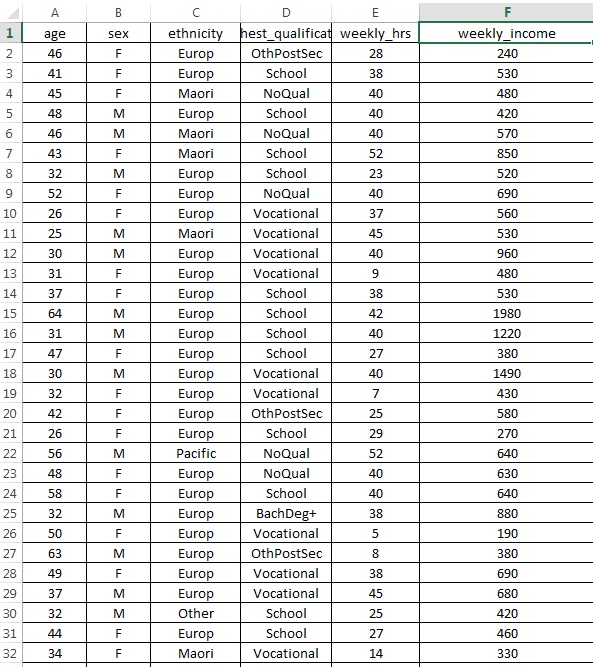
PLAN: I am going to collect my data from the spread sheet provided by carrying out simple random sampling until I have 50 male and 50 female items of data. The list is numbered from 1 to 200 so I will use a calculator to generate my random numbers and collect the data associated with that random number. I will then create 5 number summaries for both males and females, construct box plots with informal confidence intervals. From here I should be able to conclude with the answer to my question.[You will need to submit your spread sheet as evidence of your random sampling process].
I decided on simple random sampling because it is unbiased and my sample will most likely represent the population. Because the numbers of males and females are similar there is nothing to be gained by using stratified sampling which is a more complicated technique. I certainly could have used systematic sampling also unbiased and quick to do. I
didn’t notice any patterns in my data which is what you have to watch with systematic
sampling..
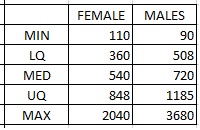
DATA: I have collected my data and produced a table of summary statistics (5 number summaries) for each gender etc. The summary statistics were:
minimum - the smallest value
lower quartile - middle of the lower half of the data
median - the middle or central value
upper quartile - the middle of the upper half of the data
maximum - the largest value
My 5 number summaries.
Having studied my sampled data I don't believe there are any invalid data values that need to be removed or 'cleaned'. All weekly income values are achievable in my opinion. Of course it is always possible that some data has been entered incorrectly.
My Boxplots with informal confidence intervals.
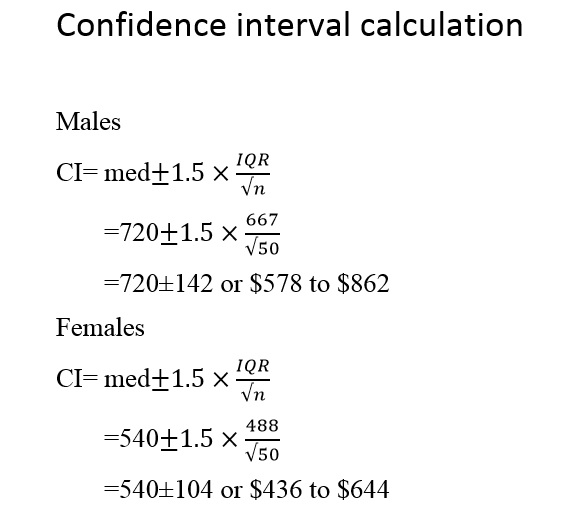
90% Confidence interval calculation
[Even before the graph is drawn it is evident that there is overlap of the confidence intervals because the highest female median is more than the lowest male median value].
The Dot Plot
TBA...
ANALYSIS
[This is where you discuss features of your graphs (Dot plots later). Features include the median values, data distribution as in shape, shift, middle 50% (the box bit), symmetry. Showing that you understand the IQR is the middle 50% is important to your report].
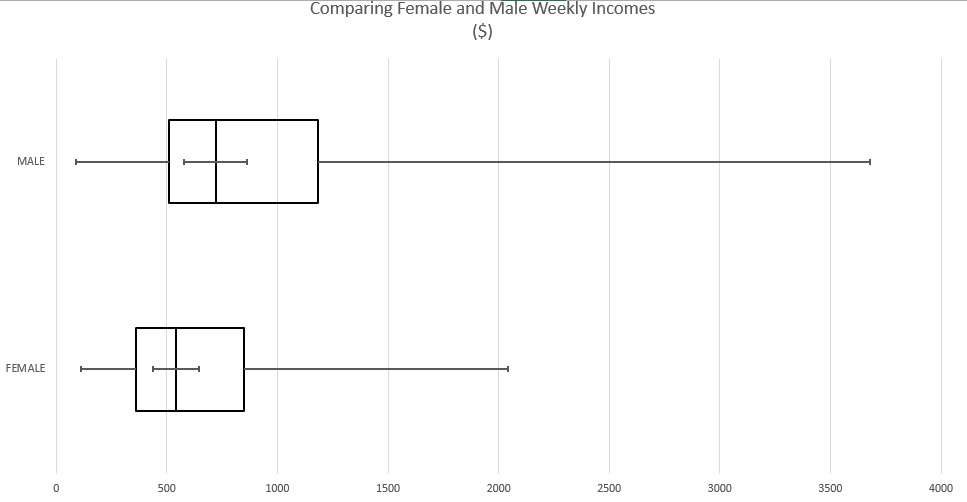
The distribution of the male and female members in my sample are skewed to the right. There are some high income earners for both males and females but the difference between them is considerable (more than $1500). The high incomes are not unusual even though the data was collected in 2003. Many CEO's, professional sports players etc can earn well in excess of this. Because we don't know where or how the data was collected we would need to be careful about the conclusions we draw here.
Males have a higher median weekly income of $720 compared to the females which is $540. There is a larger spread or middle 50% (IQR of $677) in the male data than there is for the female data (IQR of $488).
There is a much wider range of weekly income for males than females. Compare $90 - $3680 for males with $110 - $2040 for females.
There is a shift between the data distributions with the male middle 50% being shifted further up the weekly income scale.
VARIABILITY OF SAMPLING
My sample size of 50 for each gender is appropriate for this activity. Taking a larger sample would reduce variation and produce results closer to the true median values of the population. If I was to take another sample I might get different 5 number summaries but I would expect them to be similar. This means getting different medians, quartiles and confidence intervals. The confidence interval should capture the true population median 90% of the time. Because of the overlap in my boxplots, another sample could show the reverse situation where the median for females could be higher than the median male weekly income.
Based on distribution alone and before seeing the confidence intervals I was already seeing indicators that males might earn more than females back in the population. However the evidence is now looking inconclusive.
CONCLUSION
My conclusion is based on my samples and 90% confidence intervals. I can conclude that the median weekly income for males is not higher than the weekly income for females back in the population. The medians for the population should be in the interval for males ($578 - $862) and ($436 -$644) for females. The fact that there is an overlap in the confidence intervals tells me that based on the sample I can be pretty sure that the call cannot be made as to which gender has the highest median weekly income back in the population. I would undertake further research on the matter and take fresh samples to see if change resulted. The population data list of 200 is also a sample in itself and I suspect its origins and validity.
NZQA EXAMPLE LOW EXCELLENCE
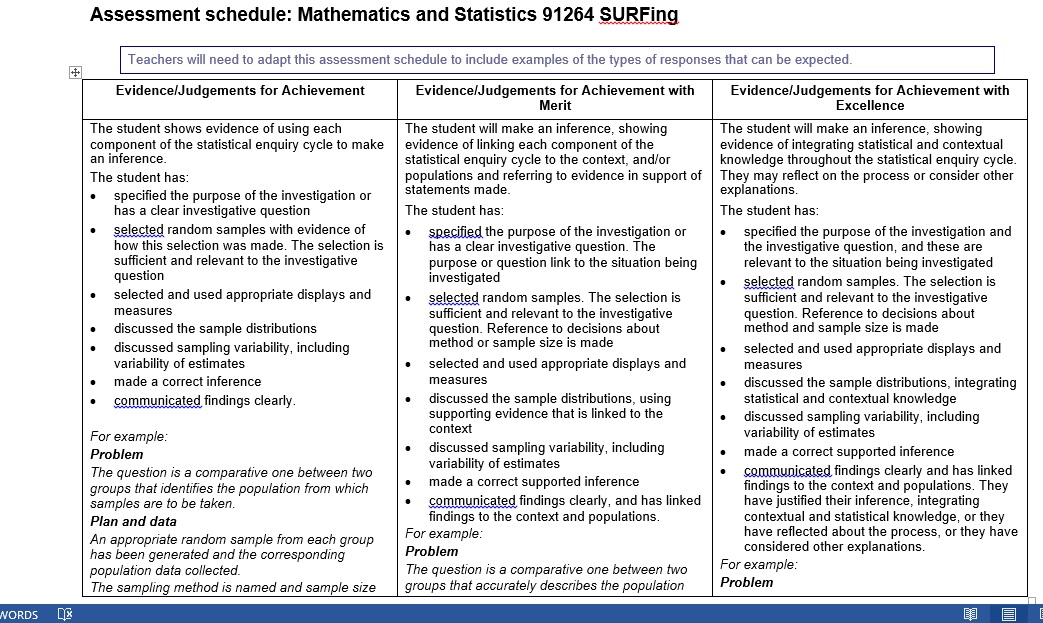
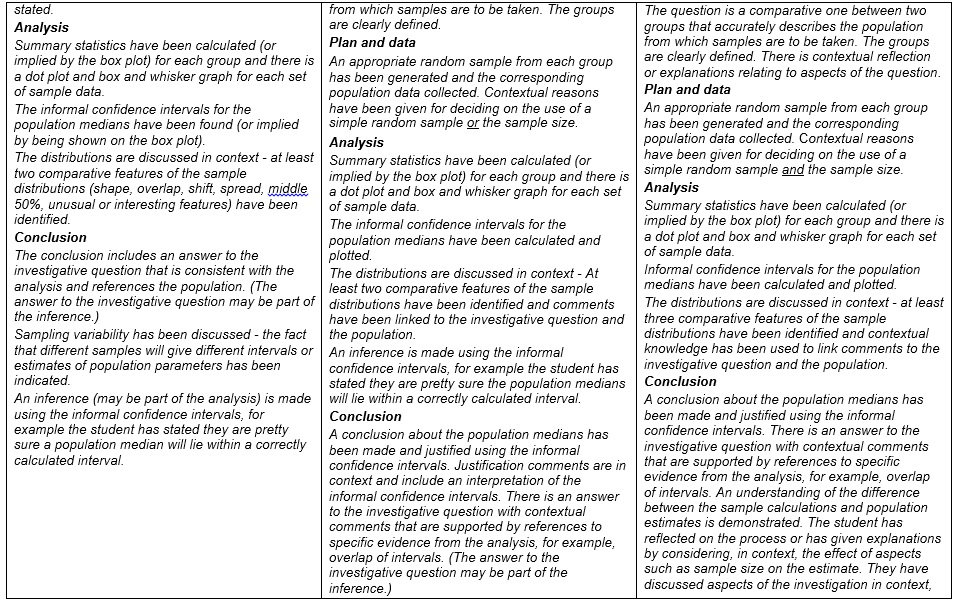
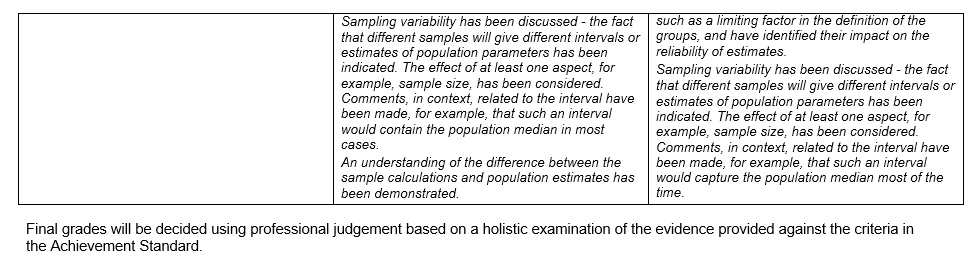
Standard Marking Schedule - each column represents Achieved Merit and Excellence. The bullet points need to addressed sufficiently to get that particular grade.