
Cars sold in Amercia
2019
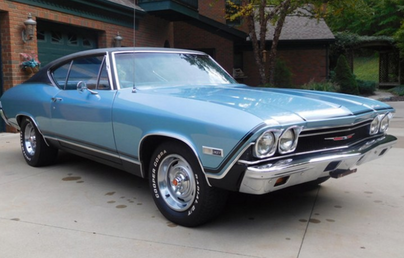
AMERICAN CARS
( CAR SALES IN THE USA)
uPDATED JUNE 2020)
General Motors, Ford and Chrysler are the leading 'Big Three' car manufacturers that are iconic to the American auto industry. They are as American as apple pie and baseball. However, according to The Financial Times ( www.ft.com/content/e40d55b0-f0ab-11e7-b220-857e26d1aca4), 2018 could continue a second year of decline in the American auto industry since the financial crisis of 2008.
Charlie Chesbrough, analyst at Cox automotive, said: “The market is coming in slightly stronger than we expected, we are looking at [2017] finishing as the fourth best of all time , but we see headwinds starting to rise.” USA Today (https://www.usatoday.com/story/money/cars/2017) states that the top 6 best-selling cars of 2017 were--
Hyundai Elantra
Chevrolet Cruze.
Ford Fusion.
Nissan Sentra.
Nissan Altima.
Honda Accord.
So it is not all bad news!
So what about the high power car market? According to Fox News ( http://www.foxnews.com/auto/2017/05/04/most-powerful-american-cars-ever.html ), "records keep getting broken and the outlook remains bullish". Doug Muro from Jelopnik.com states "When it comes to automobiles, Americans aren't so quick to embrace the small and fuel-efficient – and, I can tell you right now there are precisely two reasons why this is. Gas here is really cheap and namely: we drive everywhere! :https://jalopnik.com/why-do-americans-insist-on-having-such-large-engines-1684211066.
problem
I am interested in buying a car with a bit of muscle. I am aware that cars with larger capacity engines might cost a lot more than smaller powered cars. I want to find out if there is a relationship between engine capacity and the new price of a car - source: "New Vehicles sold in America 1993" for the purpose of predicting the car price. A car with a 2 L engine should cost less than say a car with a 5L engine.
plan
identifying the variables
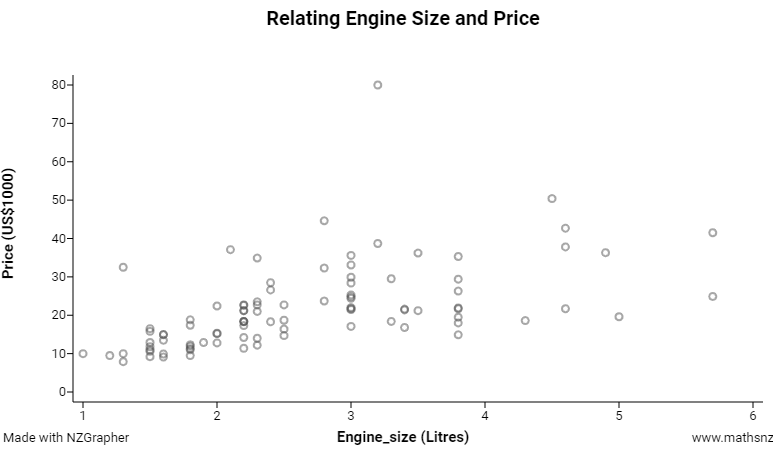
The explanatory (independent) variable is the engine size or capacity which is which is measured in litres. The response (dependent) variable is price of the new car. Price is measured in $1000.
analysis
There appears to be a linear trend as the scatter appears at the bottom left and gradually increases to the top right corner.
trend (linear/non linear)
Because the trend is linear, I will fit a linear regression line to investigate this further.
association
I can see that the association is positive because as the engine size of a car increases, the price of the car increases also.
strength
The strength of the relationship is moderate and linear as I can see that most of the points form a reasonably consistent pattern but has more scatter around the trend line. Further up the scatter is further away from the regression line.
example from bivariate cars exemplar explaining r values
These values are approximate for a positive association.
0 - no relationship
0.4 weak
0.6 moderate
0.8 - 1.0 strong
0 - no relationship
0.4 weak
0.6 moderate
0.8 - 1.0 strong
scatter
The scatter appears to be reasonably consistent for cars with an engine size below 4 litres. But above 4 litres there appear to be fewer cars, probably because there are less cars with larger engines being manufactured.
outliers
Outliers are data points that appear to be more distant from the overall trend line. For example, I will investigate 2 vehicles sold. One is a Mercedes Benz 300E. This is a foreign import and is generally rarged aa a luxioury car. This is why it is so expensive when compared to other brands for the same engine size. Another car iof interest is quite expensive for a small sized engined vehical. It is a Mazda RX-7. This is a sports car with a special kind of engine (rotary). Again this explains why it could be classed as an outlier.
grouping
Looking at the graph I cannot see any obvious groupings. This is what I would expect as there are not really two different engine capacities, they are all on a continuous range.
interpretation of the regression line
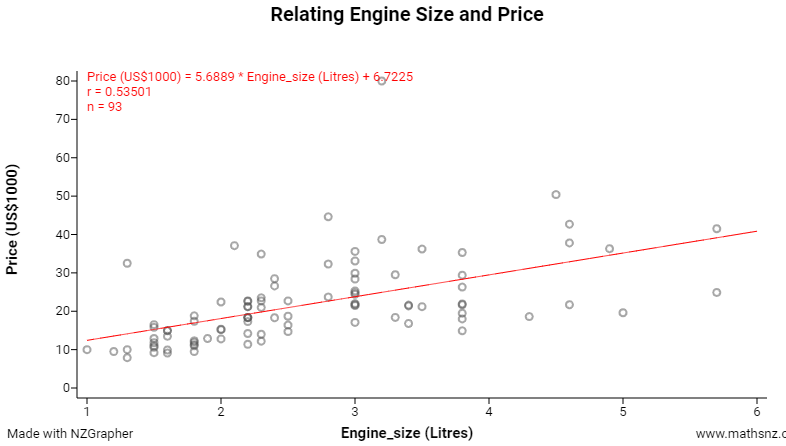
The regression line gives us the average increase over the whole graph.
The equation for the regression line:
Price = 5.6889*Engine Size(L)+6.7225
This means that for each increase in engine size or capacity of 1 Litre, the price approximately increases by about US$5700.
The equation for the regression line:
Price = 5.6889*Engine Size(L)+6.7225
This means that for each increase in engine size or capacity of 1 Litre, the price approximately increases by about US$5700.
predictions from the regression line
Price = 5.6889 x 1.75+6.7225 = $16678
Based on my regression line I would predict that a car that has an engine size of 1.75L would cost about US$16700. I am confident in this prediction because there are a number of data points around this value.
or another example:
Price = 5.6889 x 2+6.7225 = $18100
Choosing another point higher up the scale for engine size
Price = 5.6889 x 5+6.7225 = $35167
Based on my regression line I would predict that a car that has an engine size of 5L would cost about US$35000. I am not confident in this prediction because there are insufficient data points around this value to support the prediction.
prediction confidence range
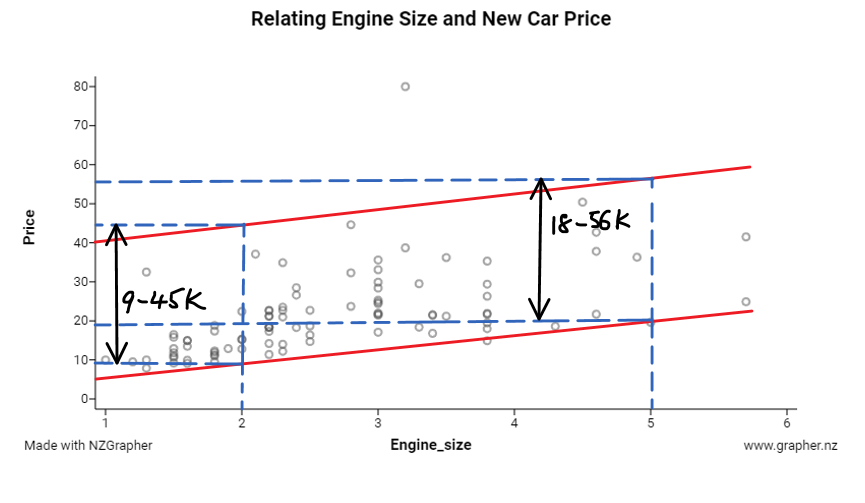
(These lines are too far apart making the band width too wide) If we look at this graph we can see that most of the points are between the dotted lines. If we go back to one of the predictions we did earlier...we can't be completely certain a vehicle with a 5L engine will cost US$36000, but we can be reasonably confident that the price of the car will be somewhere between US$18000 and US$56000.
residuals [M]
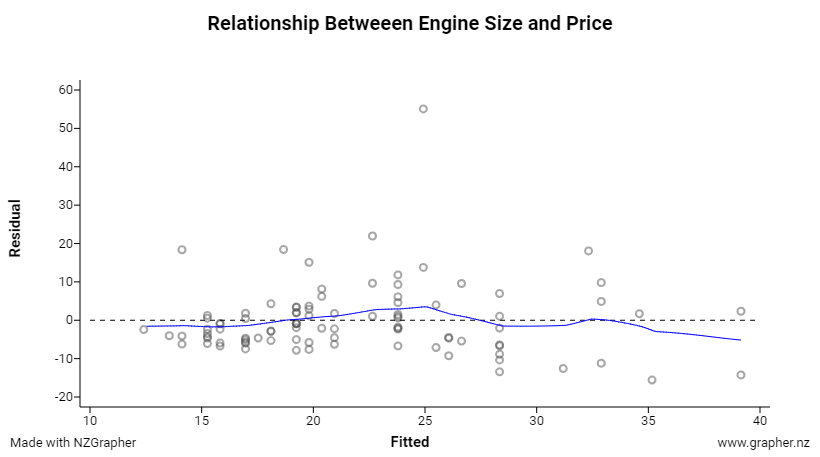
Looking at my residuals plot I think that the price of the 2 L car I predicted of $18100 will be very close to this value as all the points around $18100 are close to the prediction line. However, the predicted price of a 5L car of $35000 might actually be slightly less than this due to the few values being further away from the predicted line.
conclusion
In conclusion I think there is a moderate positive linear relationship between engine size (capacity) and the price of a car. As engine size increases so does the cost of the car. Therefore if we know the engine size of a car we should be able to predict its price. I think this information would be useful for people who which to purchase a car based on engine size. That is, if I have a small budget I am likely to by a car with a smaller size engine.
conclusion 2
merit/excellence
Causation - helpful to quote some research.
Causation
When the engine size of a car increases it does not necessarily mean that this will cause the price of the car to increase. This is because engine size is not the only factor that causes an increase in price. Other factors might include the quality of the vehical in terms of accessories, the amount of construction material used to meet compliance regulations eg 5 star safety rating. Another factor that affects a car price is engine design especially now with electric cars being developed since 1993. So this could influence current car prices aswell as engine size. For example, two cars that have the same engine size have very different prices eg [blah blah].
Conclusion
Based on the information I have gathered, I can conclude that as car engine sizes increase the price tends to increase. This is shown in the graphs above which shows a positive relationship between engine size and price. The relationship tends to be moderately strong. This means that because their are other factors affecting the price of the cars, we can't exclusively call this causation. The data is more statistically related than causational.
The linear trend line seems to be a decent fit fot the data. [data split into other groups would need a brief comment here]. This information could be useful for students looking for for their first car or for car sales reps.
I could improve my report findings by analysing other variables in the data set that also have a similar relationship. Further more, investigating data sets that are more recent (2019) should strengen the relationship that I have discovered between the two variables in this report.
DO NOT MAKE THIS STATEMENT IN A MERIT/EXCELLENCE CONCLUSION!
"This relationship is a strong one with an r value of 0.9 This means that etc etc."
A STRONG CORRELATION DOES NOT ALWAYS MEAN CAUSATION AS THERE MAY BE OTHER FACTORS INVOLVED.
"This relationship is a strong one with an r value of 0.9 This means that etc etc."
A STRONG CORRELATION DOES NOT ALWAYS MEAN CAUSATION AS THERE MAY BE OTHER FACTORS INVOLVED.
