
composition
-in what proportions of trend and seasonal is this model made?
-is this what you expected when you looked at the graph?
residuals
-what is the percentage of the residuals?
-how much confidence do you have in this model?
-why?
composition
Looking at Table 1. below we can see that the trend contributes most, about 72% to the variation in the raw data for logging in plantation forests. The seasonal component contributes about 17% to the variation. The seasonal and trend components combined follow the raw data quite well except for several peaks that are higher or lower than the raw data and the model falls down a little. For example, 2004, 2008 and 2012. This is what I expected from looking at the graph. The residual graph discussed in the next section will provide a level of confidence in the model.
the residuals
The level of the residual component as a percentage of the overall variation can be used to give us confidence in the model used to predict future trends (or not!). If the residuals are more than 10% of the overall variation of the raw data then the model falls into question and our confidence in predicting future trends may not be accurate.
NZGrapher calculates residuals including the grey line boundaries to make this a little easier to identify the values of residuals.
NZGrapher calculates residuals including the grey line boundaries to make this a little easier to identify the values of residuals.
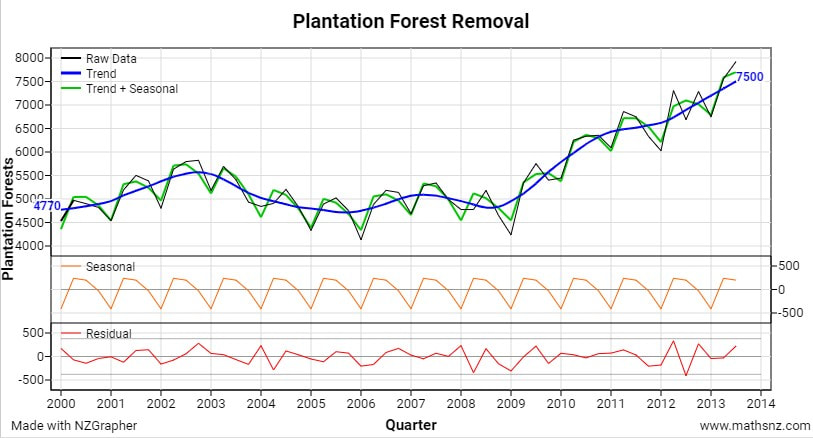
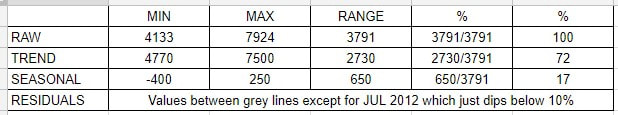
Table 1. Composition
Looking at the residuals graph there is only one peak over the last 14 years that is more than 379.1 million cubic meters of timber (10% of 3791) away from the trend. This occurred in the middle of 2012 and may have been caused by a slight drop in demand for timber. Based on the results of the residual graph I would be fairly confident about the model that NZGrapher is using for this data set.
