
10CAT
2023
DNA and Genetics explain most variations.
Information Only, NOT for your report
[Leonardo Da Vinci
Leonardo da Vinci (1452 to 1519) was an Italian painter, engineer, inventor, draughtsman, architect, sculptor, and scientist. In fact, he was considered a polymath and a genius. Born in the city of Vinci in Italy, he was taught by the Italian artist, Andrea del Verrocchio, in Florence and worked in Milan and Rome. Da Vinci’s art is amongst the most popular masterpieces in the world, some include his famous Mona Lisa (c.1503), the Vitruvian Man (c. 1490), and The Last Supper (c. 1495 to 1498).
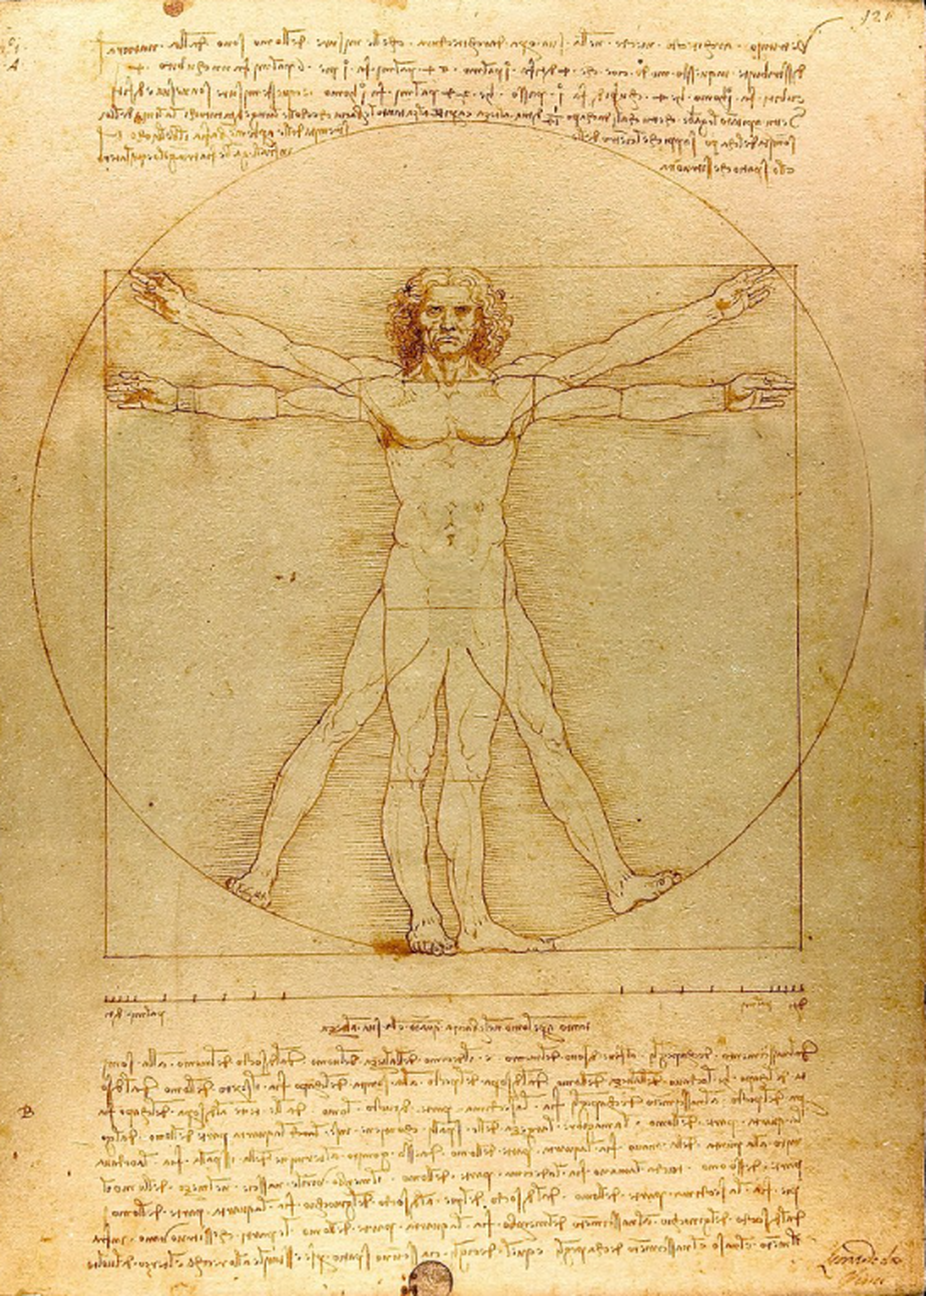
The Vitruvian Man (c. 1490) by Leonardo da Vinci is a pen and ink drawing with surrounding notes that has become one of the artist’s most famous drawings from the Renaissance period. It is based on his studies of human proportion, symmetry, and balance, bridging the gap between art and mathematics.
You might wonder, “Why was the Vitruvian Man created?”. Well, da Vinci sought to explore the connection between man and nature through his perfect marriage of mathematics and art. This was his goal and ultimately inherent in the Vitruvian Man symbolism. Da Vinci sought to reflect the macrocosm, otherwise referred to as the universe, through the microcosm, which is the human being and vice versa.
The idea of human proportions starts with what is referred to as the Canon of Proportions. This idea, for visual arts, is based on a set of ratios and measurements, that are mathematically correct, to determine the ideal proportions in which to depict the human figure and body parts.]
END OF INFORMATION SECTION
END OF INFORMATION SECTION
Problem:
The cubit is the distance from the elbow to the tip of the middle finger. I learned in class that the Egyptians used to use a cubit as a unit of measurement for building and construction. This got me interested as surely not all cubits are the same length. As I look around the class, I notice my friends have different heights and armspans. I wonder if there is a relationship also between height and cubit length? Do taller people have longer cubits, I suspect so because as we grow, our bones grow in proportion.
Our class is currently studying Leonardo De Vinci and his drawing called Vitruvian man. In his drawing, Leonardo stated several relationships that link parts of the human body to the height. One of which states:
The distance from the elbow to the tip of the hand is a quarter of the height of a man (We call thus the cubit)
So I am really interested in conducting an investigation into the claims he made. Although looking at the students in my class and studying his drawings and discovering how famous he was I predict his statements will be quite valid.
My question is, I wonder if there is a relationship between height and cubit in the students of 10CAT? I think that as we grow in height our bones will grow in proportion so our cubits will also lengthen as we get taller.
Plan:
Our group is going to investigate the relationship between height and cubit length of the students in 10CAT. To measure the heights of students we will use a fixed vertical ruler on the wall positioned 1m above the floor. This is called the height measuring station. To measure cubit length, we used a fixed ruler along the window sill.
The Explanatory (independent) variable is the height of the students in cm. The response (dependent) variable are the cubit lengths of the3 students in cm. I chose the explanatory variable of height because I think this will have the strongest effect on the relationship in the graph.
For the higher grade, you have to create the measuring station! At least state how it is constructed.
Our group is going to investigate the relationship between height and cubit length of the students in 10CAT. To measure the heights of students we will attach a vertical ruler on the wall positioned 1 m above the floor with two screws. The 1m distance is measured with a tape measure. This is called the height measuring station. To measure cubit length, we will attach a ruler with two screws along the window sill and butted up against the window frame.
To manage sources of variation (being consistent) in height measurement, our group will:
1) Shoes off, feet flat on the floor, standing straight, (to remove error due to differing sole thickness).
2) measuring to the nearest cm, This should be accurate enough for our data collection so we don't need to measure to the nearest mm.
3) Use a book, level on top of the head to ensure a correct reading.
To manage sources of variation (being consistent) in cubit measurement, our group will:
1)Place their elbow at a right angle hard against the window frame palm faced down and measure to tip of the middle finger the nearest cm. This should be accurate enough for our data collection, so we don't need to the nearest mm.
2) Don't include the nail.
3) Each member of my group had a single role during data collection, for consistency; my role was to record the values called out by the scale-reader and take them to the teacher where all of our data was put into a spreadsheet. We then uploaded the data into NZGrapher to produce a scatter graph.
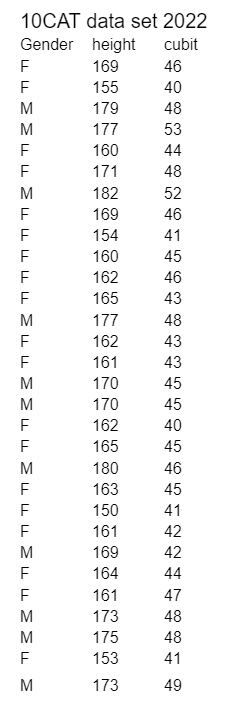
Data:
Analysis:
Because the trend appears to be linear, I will fit a linear regression line to investigate this further. This means that taller students have a longer cubit.
Because the trend appears to be linear, I will fit a linear regression line to investigate this further. This means that taller students have a longer cubit.
Trend:
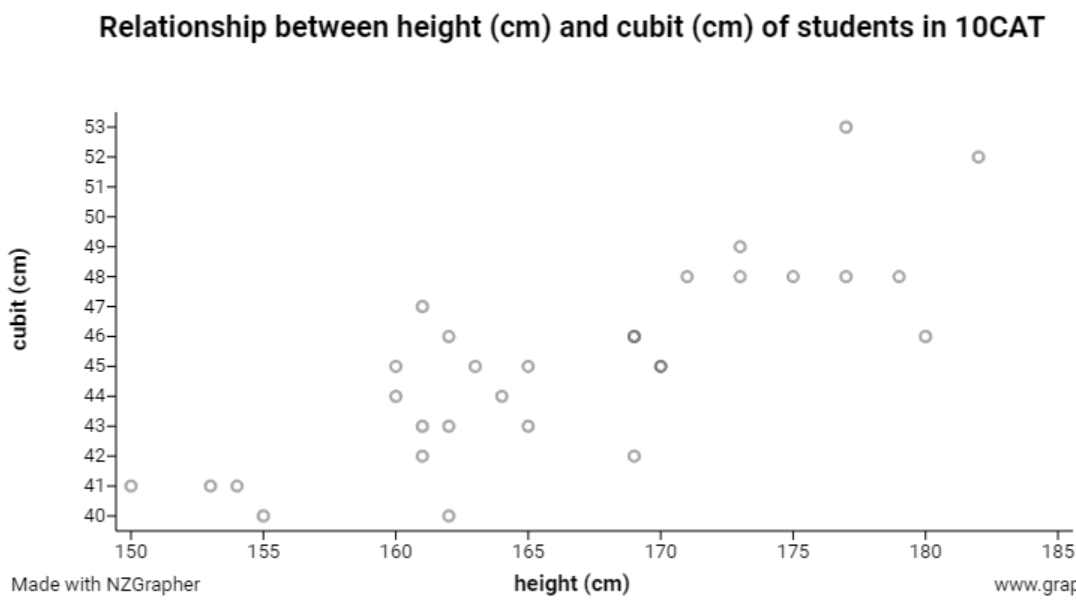
Looking at my graph, I notice that there is a linear relationship between height (cm) and cubit length (cm) of the students in 10CAT. This is because the data points form a line with a gradient or slope. Although there is a lot of variety in the data, I don't see a curve in the shape of the data points.
The trend is linear because I can't see any other shape in the data such a curve. This makes sense because people grow in a linear proportion, their bones grow proportionally with their height. Otherwise people would have unusually long limbs for their height. This could be an advantage though for sports like basketball, netball, football or where long reach is an advantage. If other limbs also grew out of proportion like the legs, they could be good for high jumping.
Association:
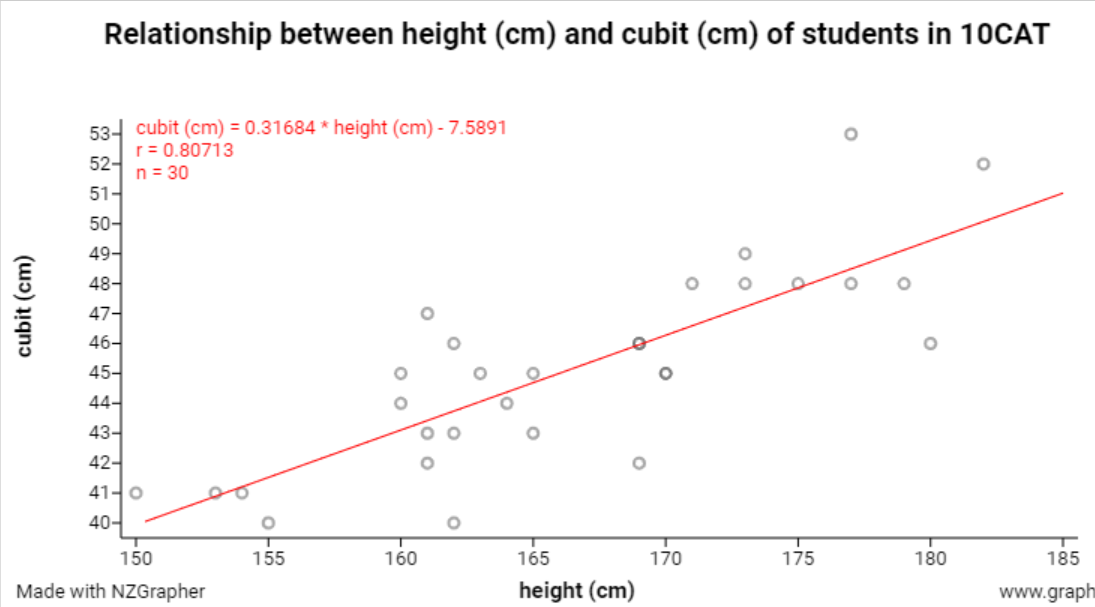
I can see that the association is positive because the trend line slopes upwards to the right, so as the heights of students increase so does their cubit length. This also means that taller students tend to have a longer cubit length.
The value of slope is taken from the equation of the line in NZGrapher which is in the form
y = mx + c
cubit = 0.31684 x height(cm) - 7.5891
This means for each increase in height of 1cm, the cubit increases by 0.32cm because m is the rate of change or slope of the line.
This makes sense, since living things tend to get larger or heavier as they get taller. I see this occurring with farm animals and so I don't think people should be any different. The rates of growth might be different for different people but in the end tall things are wider and bigger.
Since the R value should be 1 for a perfect model, an R value of 0.8 represents a reasonable fit for the data.
Strength:
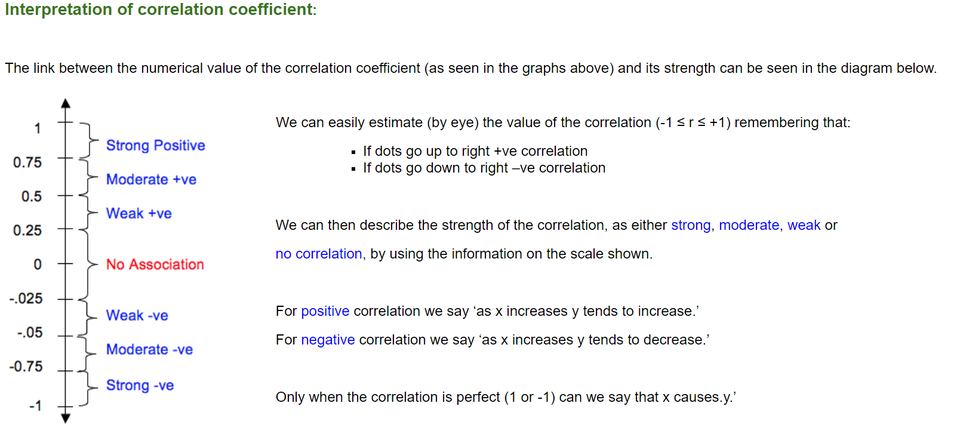
I think the strength of the relationship is a moderately one. I can see that some of the points are not far from the trend line and some are.
The r value or correlation coefficient at 0.8 though suggests the relationship is a strong one.
I notice that when the student data set is investigated using gender as a highlight, it can be seen that males cover the top right of the graph and the females, the lower portion of the graph but the strength appears similar in each gender.
Grouping:
Most of the data points are spread evenly across the graph except for a small group of students who are around the middle of the graph from about 160 to 165 cm. However, if I look at the data in terms of gender I notice two groups forming across the trend line, a lower group mainly of girls and a higher group mainly of boys. This makes sense because I notice the boys in YR10 classes appear to be taller than girls.
Girls usually have their growth spurt earlier than boys around intermediate school age and boys tend to show the first physical changes a couple of years after that in junior years at high school.
Unusual values/Outliers:
I notice one student has the longest cubit length but is not the tallest in the class. Their height is 177cm and their cubit is 53cm. In a similar way two students with the shortest cubits are not the shortest in height, 155cm and 162 cm height for 40cm cubit lengths each. This makes sense because we are all different due to genetics and DNA. Otherwise we would all be the same height weight and wingspan. We get the genetics from our parents and sometimes even our grandparents.
From my observations I don't see anyone who looks strange with shorter limbs compared to their height, like T-Rex dinosaurs which were very tall and had really short like arms. There are students with different measurements but its not noticeable at all when I look around the classroom.
Another thing to take into consideration are the age of the students. This is a YR 10 class so they are probably around 14 to 15 yrs old. So they probably have similar characteristics.
Scatter:
The data scatters or fans out slightly as the heights of students increases indicating a variation in cubit lengths. This is another indicator that there is variety in the class of YR10 students. However, I don't notice anyone in the class who has longer or shorter than usual lengths of limbs.
The data scatters or fans out slightly as the heights of students increases indicating a variation in cubit lengths. This is another indicator that there is variety in the class of YR10 students. However, I don't notice anyone in the class who has longer or shorter than usual lengths of limbs.
Conclusion:
After investigating my sample of data, I can say there is a moderately strong linear relationship between height(variable 1) and cubit length (variable 2) in YR10CAT students at Henderson High School. I am not surprised by this result as I expect that our bones grow in proportion as we grow in height. Leonardo Da Vinci stated that the 'The distance from the elbow to the tip of the hand is a quarter of the height of a man, the cubit). This is a ratio of 1:4, eg, a person with a height of 180cm might have a cubit of 45cm. The ratio we found here was about 1:3 (1/0.32). However we need to remember that Da Vinci studied the dimensions of adults and not teenagers so we cant fully back up his claim.
After investigating my sample of data, I can say there is a moderately strong linear relationship between height(variable 1) and cubit length (variable 2) in YR10CAT students at Henderson High School. I am not surprised by this result as I expect that our bones grow in proportion as we grow in height. Leonardo Da Vinci stated that the 'The distance from the elbow to the tip of the hand is a quarter of the height of a man, the cubit). This is a ratio of 1:4, eg, a person with a height of 180cm might have a cubit of 45cm. The ratio we found here was about 1:3 (1/0.32). However we need to remember that Da Vinci studied the dimensions of adults and not teenagers so we cant fully back up his claim.
Improvements:
I could improve my investigation by measuring student height more accurately, including checking (quality control of the measurement processes) regarding errors due to shoes, hair length and accessories. For example, measuring to the nearest mm rather than the cm. For managing other sources of variation we could get one student or group of students to do the whole measuring task. This would eliminate mistakes in reading the measuring ruler used in the cubit and height measuring station.
I think that this investigation could have been more reliable if we were to have a larger sample size. The sample size of 30 for our class is considered to be reasonably large enough to represent all YR10 students at Henderson High school. However, the presence of unusual values or outliers can skew the results like the strength of the relationship in small samples like that which can happen in one class. Therefore I would collect more data, say combine two or more classes to improve the accuracy of our investigation. If we had a larger sample size, I would have more confidence in the strength and direction of the relationship. The data could then more accurately reflect the relationship of height and cubit across all year 10 students at our school.
I believe that if another year 10 math class were to do this experiment they would have highly similar results. This is because many students are the same size and age like in our class.
Because of this relationship I believe I could predict a students height based on their cubit using the trend line to achieve this. For example, using the data, a student who has a cubit of 42cm would be about 157 cm in height.
Other investigations:
I could investigate other age groups to see if the relationship would hold. Our class results may not represent a wider population though. This is because older people tend to lose a little height as they age but arms and legs tend to stay the same length. Young children like toddlers tend to have large heads and bodies compared with their arms and legs. So they may have a different ratio of height to cubit length than our class. This means we should include a sample from all age ranges to reflect what is happening in the population.
I could investigate other age groups to see if the relationship would hold. Our class results may not represent a wider population though. This is because older people tend to lose a little height as they age but arms and legs tend to stay the same length. Young children like toddlers tend to have large heads and bodies compared with their arms and legs. So they may have a different ratio of height to cubit length than our class. This means we should include a sample from all age ranges to reflect what is happening in the population.
Who might find this investigation useful?
This data could be of importance for the medical profession to determine if any student has a medical problem due to growth. Sports team managers and coaches can target players during training knowing their heights and other bone lengths. This could be useful in choosing their position in a particular code. Tall students for basketball or netball and lineouts in rugby, goal keepers in football.
This data could be of importance for the medical profession to determine if any student has a medical problem due to growth. Sports team managers and coaches can target players during training knowing their heights and other bone lengths. This could be useful in choosing their position in a particular code. Tall students for basketball or netball and lineouts in rugby, goal keepers in football.
