Linear programming
Linear programming is the process of finding a maximum or minimum value
for an objective function that is subject to several constraints. This involves:
for an objective function that is subject to several constraints. This involves:
- Writing and graphing equations for the constraints to find a feasible region that satisfies all equations at once.
- Finding the coordinates of each of the three vertices of the feasible region
- Evaluating an objective function at each vertex of the feasibility region
- Deciding which corner of the feasibility region represents a maximum or a minimum
casio graphing calculator
run the application program
for the casio graphics calculator below to see if the link works.
| fx9860emulator.exe |
DESMOS PRACTICE
Open up DESMOS and enter the following line equations. Later we will then see how to do the shading for this so that one side of the line is clear and other shaded in.
Lesson 1 drawing the graphs in desmos
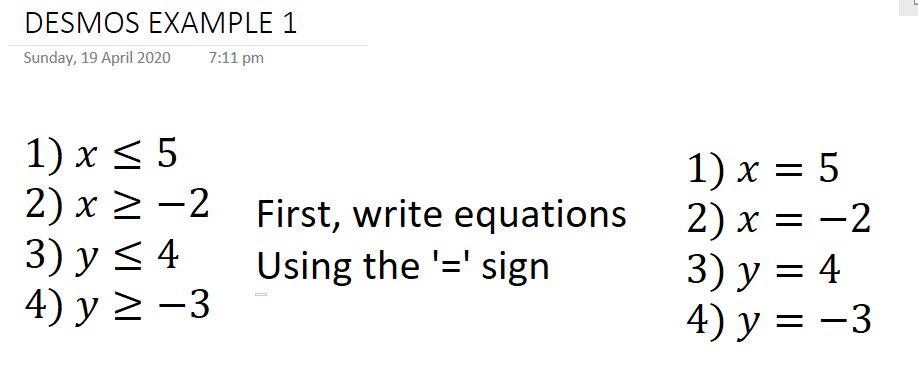
Video help For drawing the 4 lines above. Use the slider at the bottom of the video to see the whole video - not sure what is happening there. And the video ends abruptly!
Desmos video drawing the vertical line equations
Lesson 2 shading in the graphs
using the inequality symbol
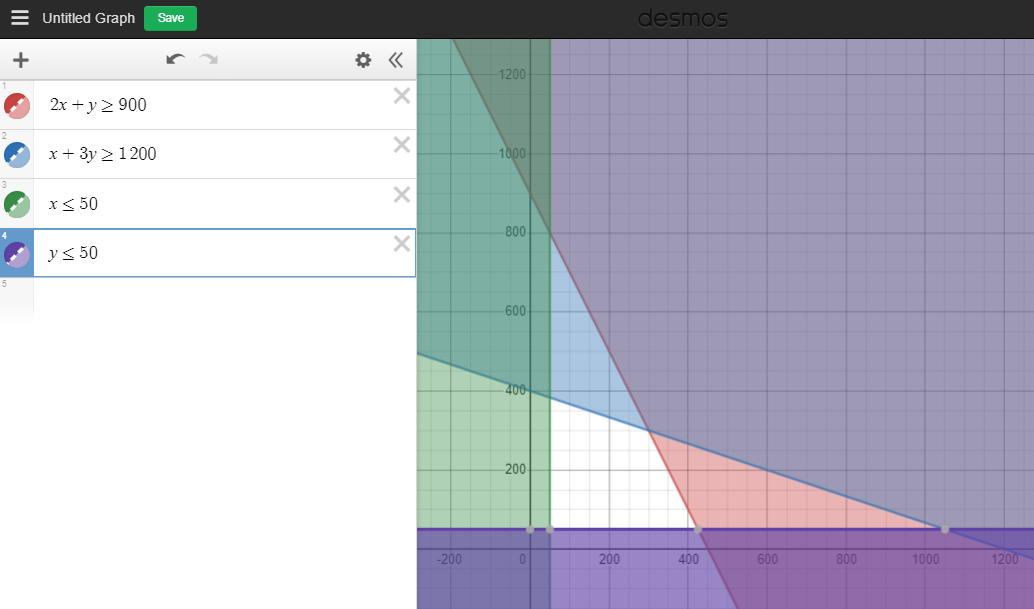
The graph below is what we are aiming for and was done on DESMOS.
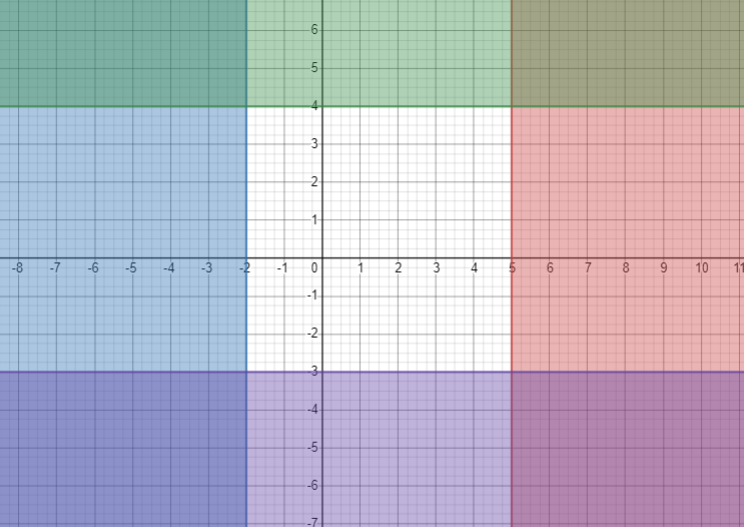
Before we do that we need to see how it's done manually using the True/False method. To work out which side of the line to shade in we replace x and y, the left hand variables with 0. If the statement is True we shade the opposite side of the line. If false, we shade the same side of the line. Let's see how this works with our current example above in the video below. (Remember that DESMOS does this automatically but with a little adjustment).
video shading in the lines - the theory behind it
using DESMOS to draw the graphs
The line equations are called CONSTRAINTS! The unshaded region inside the lines is called The Feasibility Region. Meaning that all values inside that region will support a particular economic model - money will come out of it! After watching the video, copy the process in DESMOS.
OK, listed below are 4 contraint equations which when graphed will produce a Feasibility region. Sketch the graphs in DESMOS firstly by using the equal sign. This will provide an indication of what the graph outline will look like. The numbers are larger so you will have to change the DESMOS scale so the feasibility region is visible by zooming out. I will do a video tutorial tomorrow.
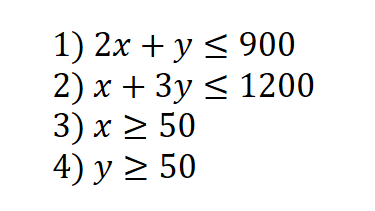
Step 1: putting in the basic equations into DESMOS
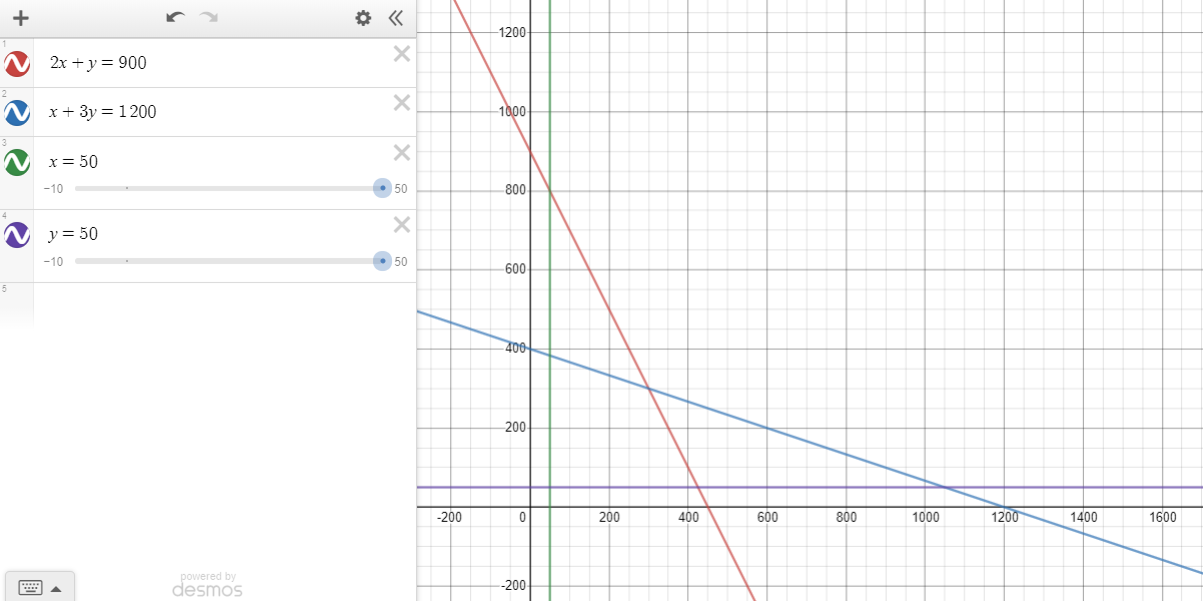
Step 2: Change the inequality symbols around to their opposite directions.
So work through this example on DESMOS to get a handle on this because we will now be using DESMOS for doing our assessment whenever/wherever we reach our destination.
In the next lesson we will look at how to find the points of intersection on the graph.
In the next lesson we will look at how to find the points of intersection on the graph.
Labeling points with DESMOS
term 2 week 3
getting equations from context
I was just thinking after working on this tutorial about a company selling coal and timber, that it's possible to gain achievement without really understanding what is going on. It certainly becomes clearer if you go for Merit and higher. I will try to explain this in later tutorials.
1) NZ COAL AND CARBON version 1
NZ coal and carbon uses two freight trains to deliver coal and timber to their depot.
Train A can carry 2 Tonnes of coal and 1/2 Tonne of timber per trip.
Train B can carry 1 Tonne of coal and 1 Tonnes of timber per trip.
Each day the trains need to deliver at least 10 Tonnes of coal and 7 Tonnes of timber.
The maintenance crew has told management that the trains cannot make any more than 8 trips per day (each train)
ACHIEVED
Form a couple of equations
Draw them on DESMOS
OK, where do we start?
1) Label the x axis train A and the y axis train B (or the other way around - same result in the end) You don't have to do that in DESMOS now, you can write it on the graph once its done and pasted into your document. (TBH - I don't know how to label graphs in DESMOS yet either).
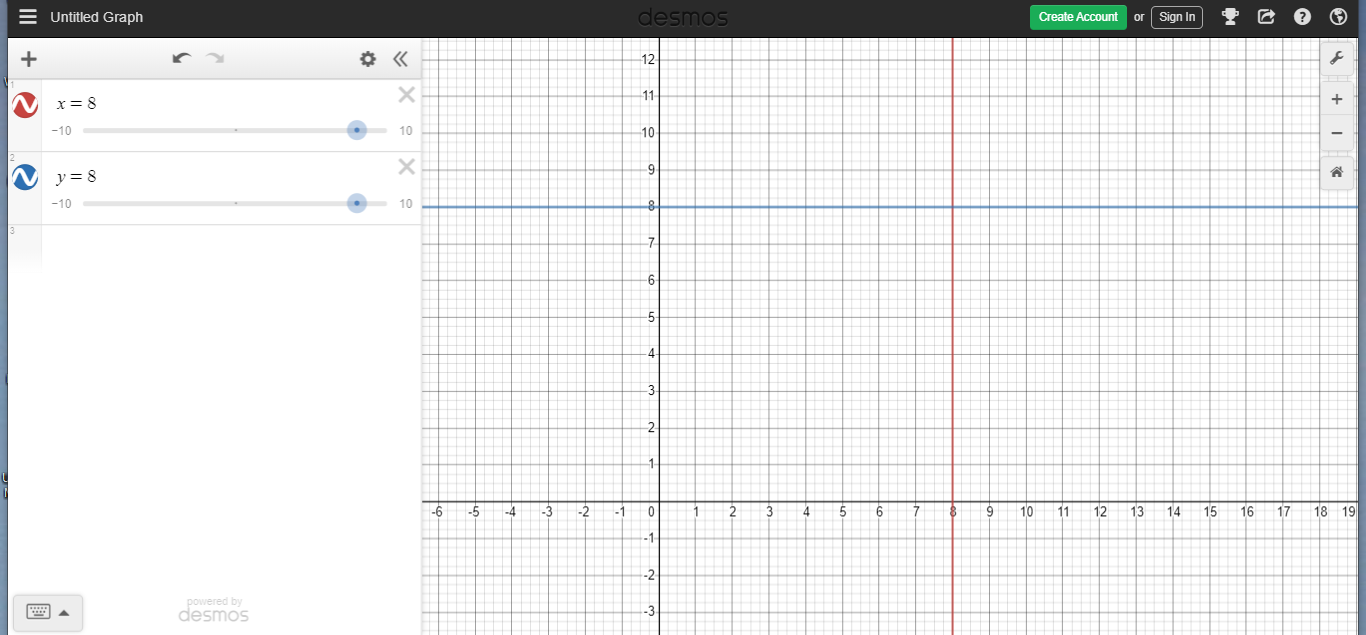
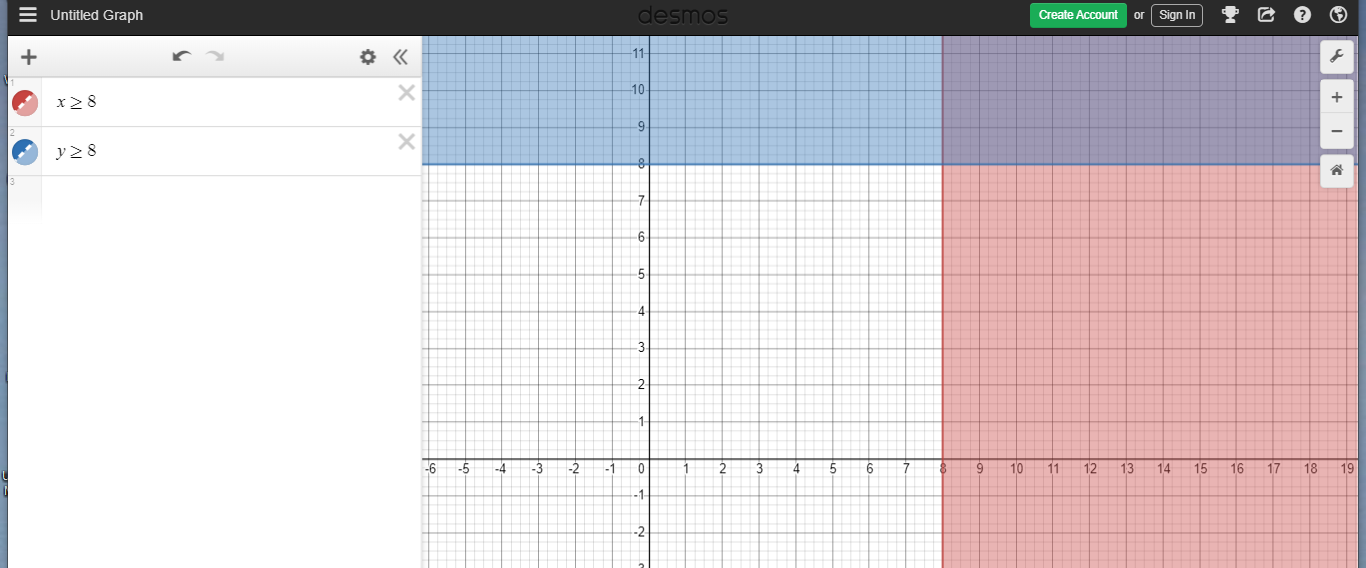
2) Locate the vertical and horizontal lines (just like in our other practices). Remember the graphs will look very similar to what we have looked at so far. "the trains (x and y) cannot make any more than 8 trips per day ". This means that x is less than or equal to 8 and y is also less than or equal to 8. Put into DESMOS. First manually and shading in with a pencil, using the equal sign in the equation.
And with shading
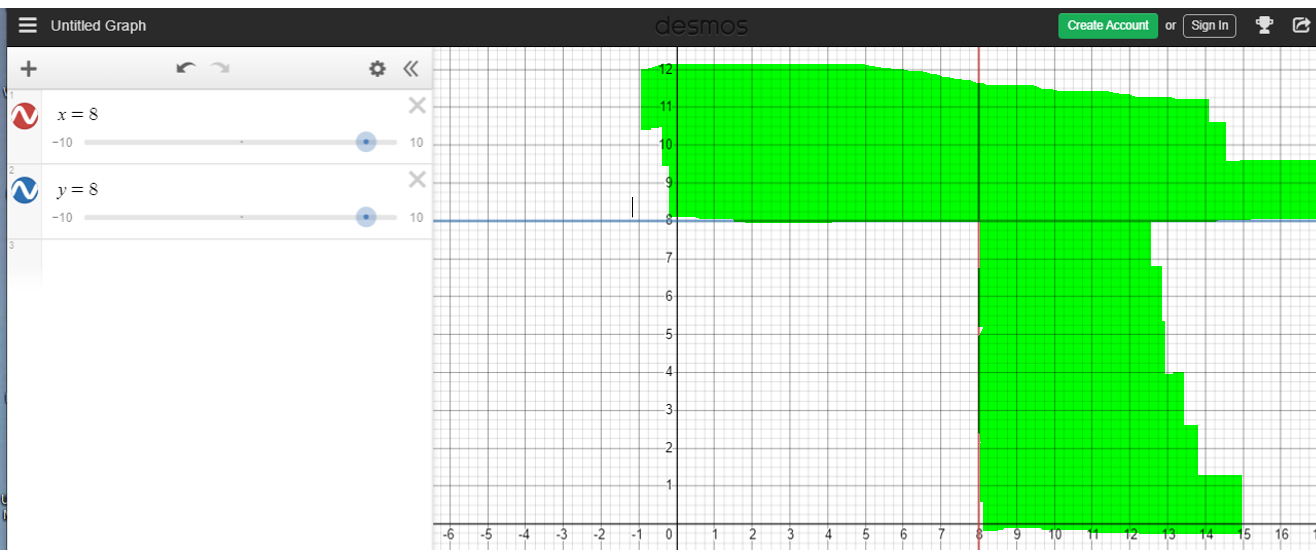
Or like we have been learning , if you reverse the direction of the inequality sign DESMOS will do this automatically.
so x is less than or equal to 8 becomes x is greater than or equal to 8 and do the same for y
so x is less than or equal to 8 becomes x is greater than or equal to 8 and do the same for y
We are now half way there. And by the way, the two graph lines above are not considered difficult enough for the standard.
We are now going to write 2 equations. One for Coal and one for Timber. Notice that they look like a set of simultaneous equations the way they are written.
Train A can carry 2 Tonnes of coal and 1/2 Tonne of timber per trip.
Train B can carry 1 Tonne of coal and 1 Tonnes of timber per trip.
Each day the trains need to deliver at least 10 Tonnes of coal and 7 Tonnes of timber.
The maintenance crew has told management that the trains cannot make any more than 8 trips per day (each train)
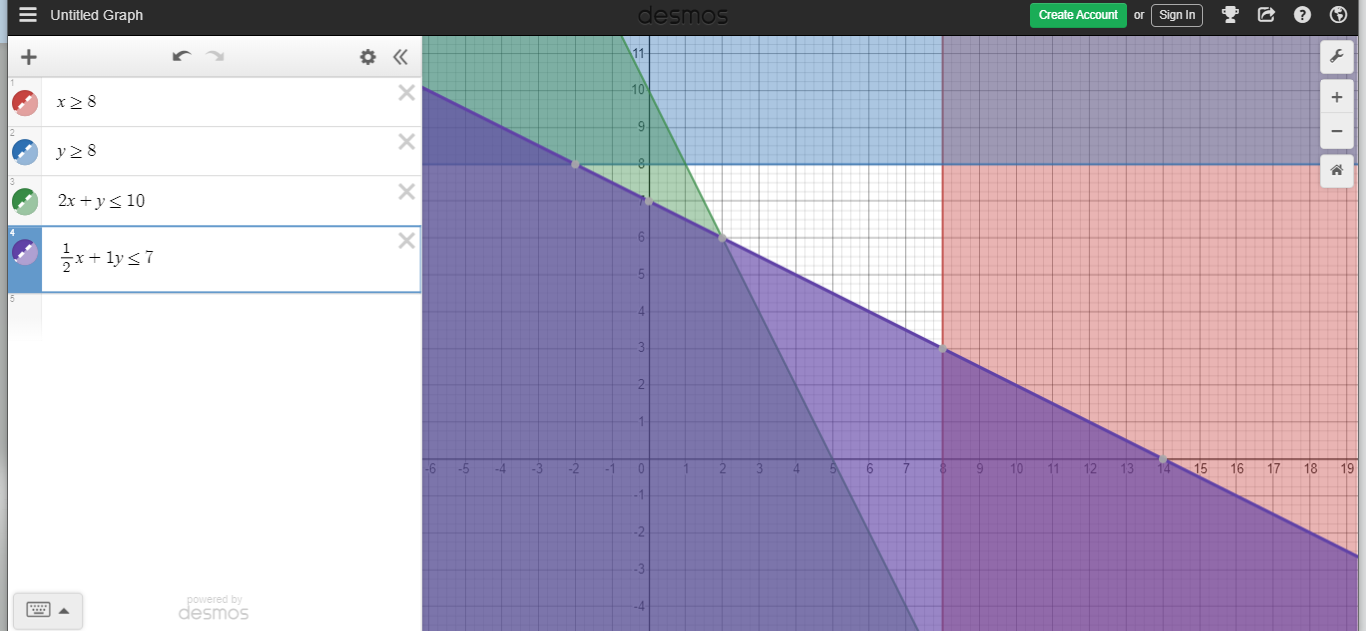
For the coal equation look vertically at the coal values, they are 2 and 1 so we get
2x + 1y is greater or equal to 10 (from the statement below the equations) .We cant have any less than 10 tonnes because we are in business to make huge sums of money. If we go below that our operating costs might swamp the business - its just a made up story!
For the timber equation look vertically at the timber values, they are 1/2 and 1 so we get
1/2x + 1y is greater or equal to 7 (from the statement below the equations again). We cant have any less than 7 tonnes because we are in business to make huge sums of money etc.
A little practise will help you get there. OK, would you believe a lot of practise might help?
Now putting this into DESMOS.
We are now going to write 2 equations. One for Coal and one for Timber. Notice that they look like a set of simultaneous equations the way they are written.
Train A can carry 2 Tonnes of coal and 1/2 Tonne of timber per trip.
Train B can carry 1 Tonne of coal and 1 Tonnes of timber per trip.
Each day the trains need to deliver at least 10 Tonnes of coal and 7 Tonnes of timber.
The maintenance crew has told management that the trains cannot make any more than 8 trips per day (each train)
For the coal equation look vertically at the coal values, they are 2 and 1 so we get
2x + 1y is greater or equal to 10 (from the statement below the equations) .We cant have any less than 10 tonnes because we are in business to make huge sums of money. If we go below that our operating costs might swamp the business - its just a made up story!
For the timber equation look vertically at the timber values, they are 1/2 and 1 so we get
1/2x + 1y is greater or equal to 7 (from the statement below the equations again). We cant have any less than 7 tonnes because we are in business to make huge sums of money etc.
A little practise will help you get there. OK, would you believe a lot of practise might help?
Now putting this into DESMOS.
Finally identify points of intersection (hover your mouse over them and record their values). And that's all I want to focus on for the next 3 or 4 sessions. More examples to follow later.
Example 1: putting it together video tutorial
example 1 video 2
example 1 video 3
(not 2nd!)
example 2
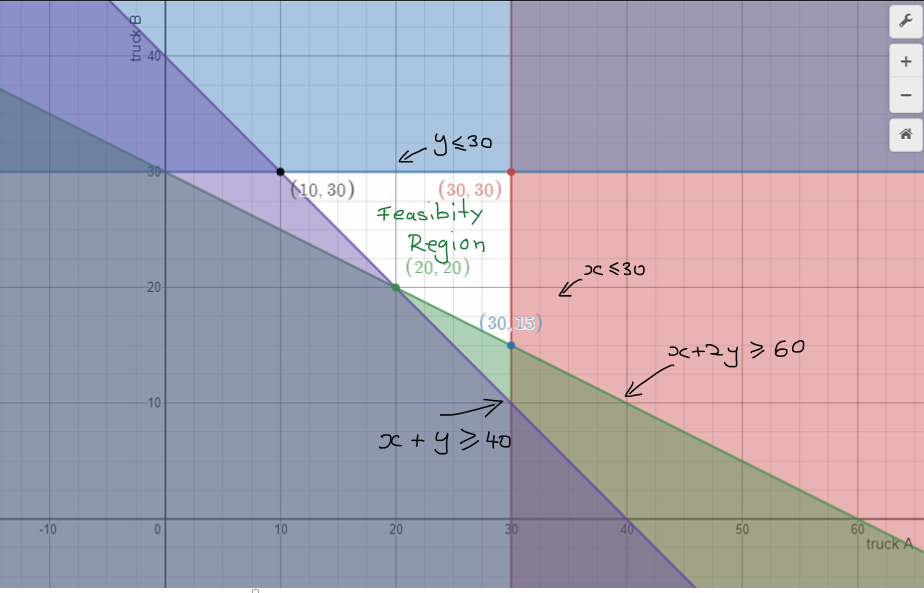
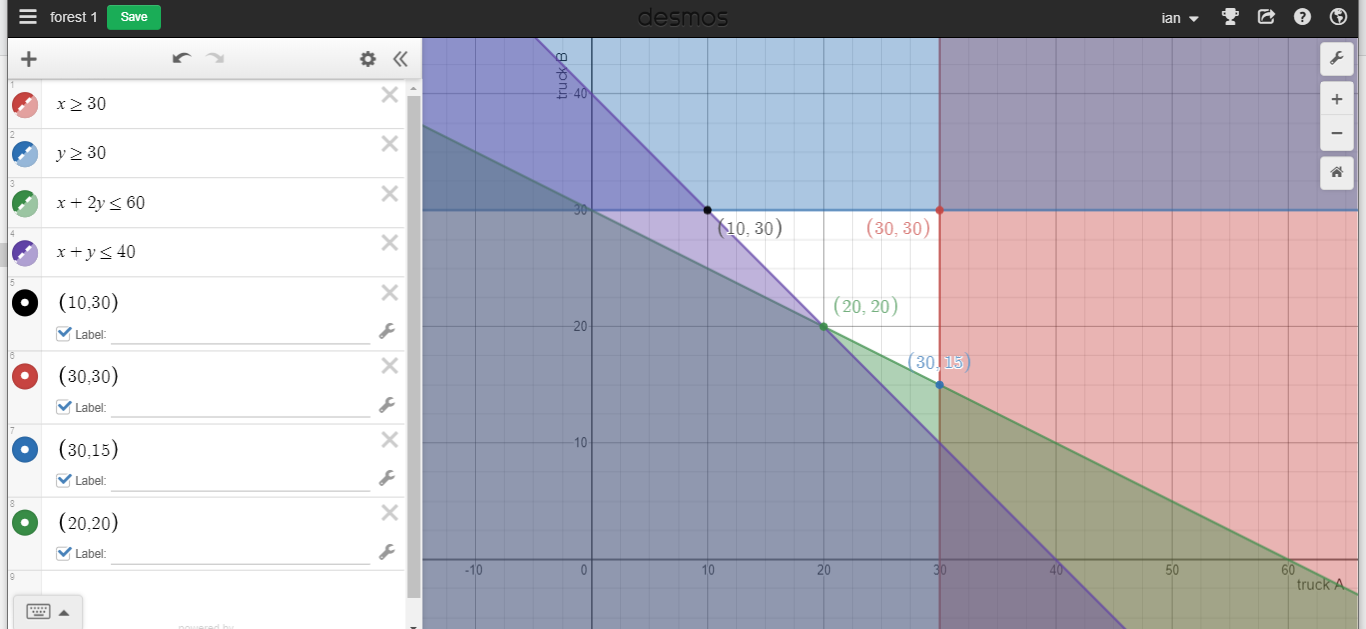
NZ Forest Ltd deliver two types of timber to the market, pine and native using two logging trucks.
Truck A can carry 1 Tonne of pine and 1 Tonne of native timber per trip.
Truck B can carry 2 Tonnes of pine and 1 Tonne of native timber per trip.
Each day the trucks need to deliver at least 60 Tonnes of pine and at least 40 Tonnes of native timber.
The maintenance crew has told management that truck A can make no more than 30 trips per day and truck B, no more than 30 trips per day
achievement criteria
x = number of trips for Truck A
y = number of trips for Truck B
x + 2y ≥ 60 (Pine timber)
x + y ≥ 40 (Native timber)
x ≤ 30 (Truck A Trip)
y ≤ 30 (Truck B Trip)
y = number of trips for Truck B
x + 2y ≥ 60 (Pine timber)
x + y ≥ 40 (Native timber)
x ≤ 30 (Truck A Trip)
y ≤ 30 (Truck B Trip)
- I will find the equation of a linear inequality
- My graph shows the feasible region graphically, correctly showing at least two of the constraints. (Notice that all graph lines are visible).
adding the finishing touches
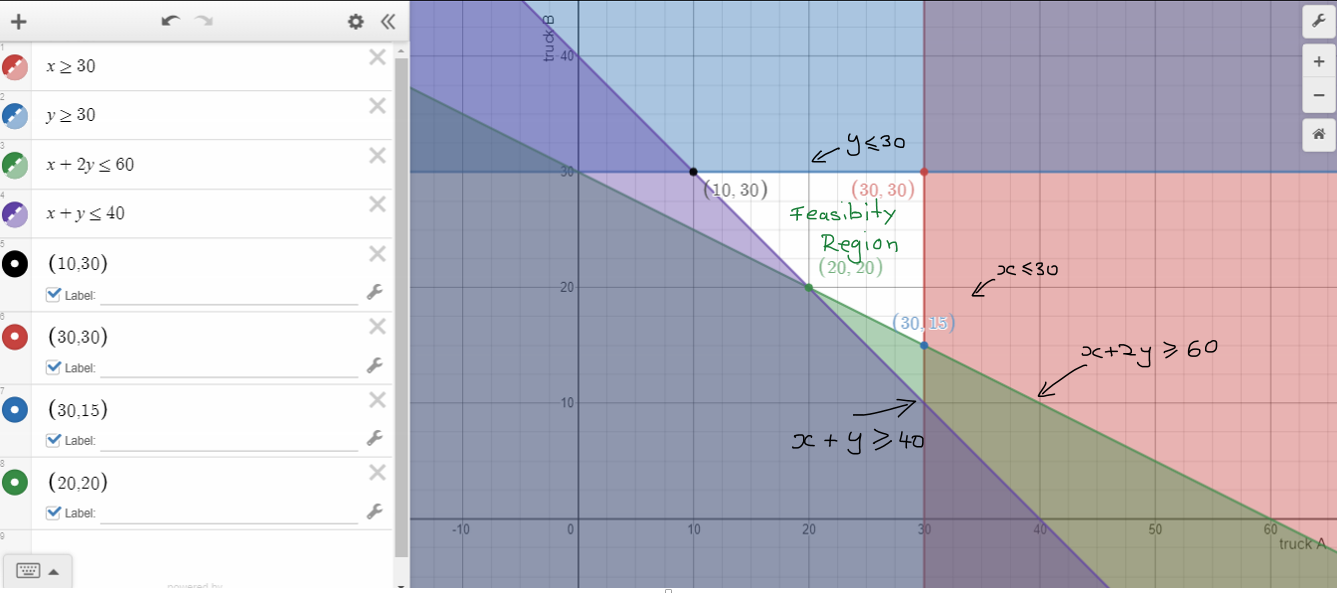
But in the assessment just include your graph and equations thus:
x = number of trips for Truck A
y = number of trips for Truck B
x + 2y ≥ 60 (Pine timber)
x + y ≥ 40 (Native timber)
x ≤ 30 (Truck A Trip)
y ≤ 30 (Truck B Trip)
y = number of trips for Truck B
x + 2y ≥ 60 (Pine timber)
x + y ≥ 40 (Native timber)
x ≤ 30 (Truck A Trip)
y ≤ 30 (Truck B Trip)