
10FUN
Problem
My question is: I wonder if there is a relationship between height and foot length of the students in 10FUN
Plan
Blah blah...
My question is: I wonder if there is a relationship between height and foot length of the students in 10FUN
Plan
Blah blah...
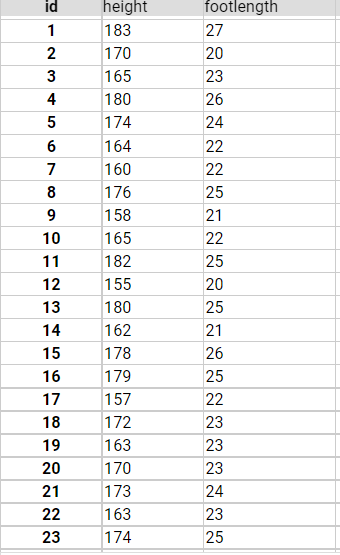
Data
Analysis using T-A-S-G-U-S
Trend:
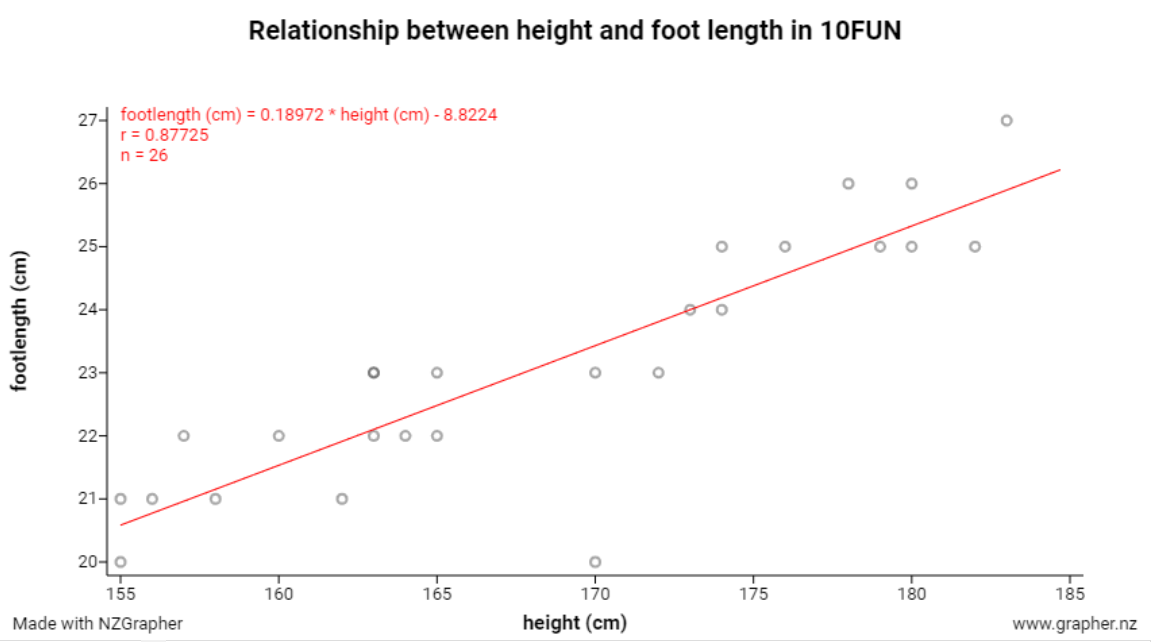
Looking at my graph, I notice that there is a linear relationship between height (cm) and foot length (cm) of the students in 10FUN. This is because the data points form a line with a gradient or slope. I don't see a curve in the data points.
Association:
I can see that the association is positive because the trend line slopes upwards to the right, so as the heights of students increase so does their foot length. This also means that taller students tend to have a long foot length and wear larger shoe sizes.
Trend:
Looking at my graph, I notice that there is a linear relationship between height (cm) and foot length (cm) of the students in 10FUN. This is because the data points form a line with a gradient or slope. I don't see a curve in the data points.
Association:
I can see that the association is positive because the trend line slopes upwards to the right, so as the heights of students increase so does their foot length. This also means that taller students tend to have a long foot length and wear larger shoe sizes.
Strength
I think the strength of the relationship is moderately strong as I can see that most of the points are not far from the trend line.
Groups:
Looking at the graph I can see that the data points form two separate groups. One group of students measuring 165cm in height and below form one group and students measuring 170cm in height and above form the second group.
Unusual Values:
I notice looking at the graph that there is one student who is 170cm in height and has a foot length of 20cm. This is possibly an outlier because the data point is far from the trend line. One of the shortest students (155cm) also has the same foot length so it could be possible. I should have rechecked that measurement as it could be a measurement error.
Scatter:
Except for the gap between the two groups of students the scatter appears to be reasonably consistent for measurements above and below the trend line.
Conclusion
In conclusion I think there is a strong positive linear relationship between the heights of students in 10FUN and their foot length. Taller students have longer and therefore bigger feet.
In conclusion I think there is a strong positive linear relationship between the heights of students in 10FUN and their foot length. Taller students have longer and therefore bigger feet.
