
TIME SERIES 6
logging of new zealand's Natural forests
[update 10th March 2019]
Problem and Plan.
I am interested in environmental issues including the protection of our natural forests which should be preserved for future generations of New Zealanders to enjoy. According to the Ministry of Primary Industries (M.P.I), New Zealand's native forests have economic, environmental, cultural and recreational value. Although most of New Zealand's indigenous forests are on conservation land, a significant portion are privately-owned. Although privately owned land has strict logging conditions imposed on it by government, data indicates an increasing and potentially worrying trend in the data. This can also be explained by an increasing demand for NZ natural hardwood timbers. New Zealand timbers, such as silver beech, have distinctive properties (e.g. colour, grain) valued by niche markets in the USA, Australia, and Japan (sources - Donnelly 2011 and www.mpi.govt.nz/growing-and-harvesting indigenous-forestry and New Zealand’s Indigenous Forests and Shrublands Robert B. Allen, Peter J. Bellingham, Robert J. Holdaway, Susan K. Wiser Landcare Research, PO Box 69040, Lincoln 7640, New Zealand).
I am interested in environmental issues including the protection of our natural forests which should be preserved for future generations of New Zealanders to enjoy. According to the Ministry of Primary Industries (M.P.I), New Zealand's native forests have economic, environmental, cultural and recreational value. Although most of New Zealand's indigenous forests are on conservation land, a significant portion are privately-owned. Although privately owned land has strict logging conditions imposed on it by government, data indicates an increasing and potentially worrying trend in the data. This can also be explained by an increasing demand for NZ natural hardwood timbers. New Zealand timbers, such as silver beech, have distinctive properties (e.g. colour, grain) valued by niche markets in the USA, Australia, and Japan (sources - Donnelly 2011 and www.mpi.govt.nz/growing-and-harvesting indigenous-forestry and New Zealand’s Indigenous Forests and Shrublands Robert B. Allen, Peter J. Bellingham, Robert J. Holdaway, Susan K. Wiser Landcare Research, PO Box 69040, Lincoln 7640, New Zealand).
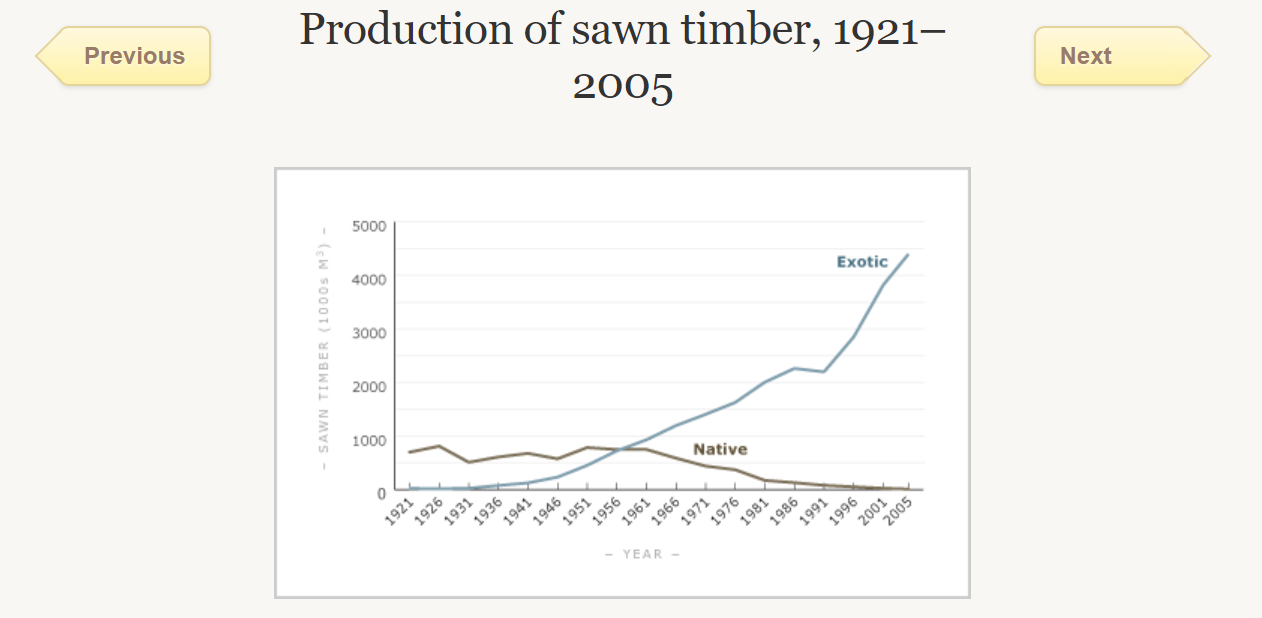
This graph shows the gradual decrease in milling of native timber and the dramatic increase in exotic timber production from 1921, when a state forestry programme began. Although the production of exotic timber exceeded that of native species by 1960, and continued to increase, native forests were still logged steadily into the 1970s. Political change then led to a decline, and now only a minuscule amount of native timber is produced in New Zealand. (Source - Nancy Swarbrick, 'Logging native forests - Sustainable forest management', Te Ara - the Encyclopedia of New Zealand, http://www.TeAra.govt.nz/en/graph/12901/production-of-sawn-timber-1921-2005 (accessed 2 March 2019)
Using data obtained from NZGrapher (from MPI) I will investigate whether the logging of New Zealand's indigenous forests are increasing or decreasing over the years. If we really care about the value of our native forests I would expect to see a decrease in the amount of logging or at least a sustainable management system implemented to allow limited logging. I am also going to predict the amount of logging of indigenous forests over the next 2 years.
Using data obtained from NZGrapher (from MPI) I will investigate whether the logging of New Zealand's indigenous forests are increasing or decreasing over the years. If we really care about the value of our native forests I would expect to see a decrease in the amount of logging or at least a sustainable management system implemented to allow limited logging. I am also going to predict the amount of logging of indigenous forests over the next 2 years.
The variables:
Natural forests - The volume of wood removed from the natural forests in million of metres cubed.
Time Period - quarterly (3 monthly)
Data source:
The data used in this investigation comes from The Ministry of Primary Industries and NZGrapher.
Natural forests - The volume of wood removed from the natural forests in million of metres cubed.
Time Period - quarterly (3 monthly)
Data source:
The data used in this investigation comes from The Ministry of Primary Industries and NZGrapher.
Analysis:
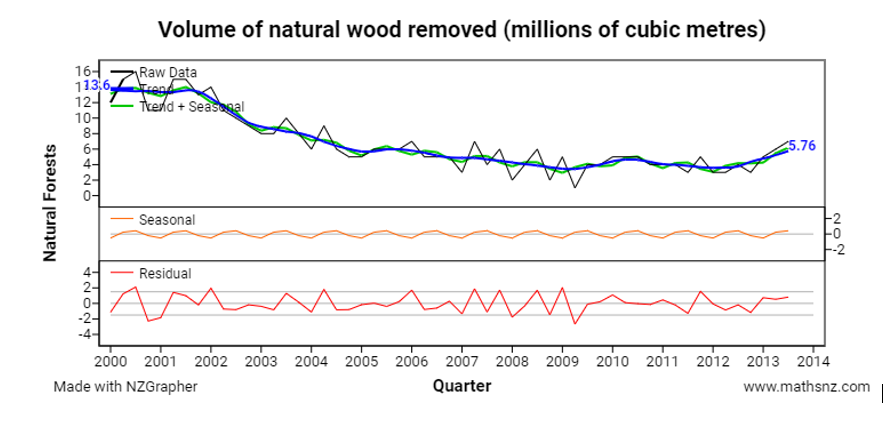
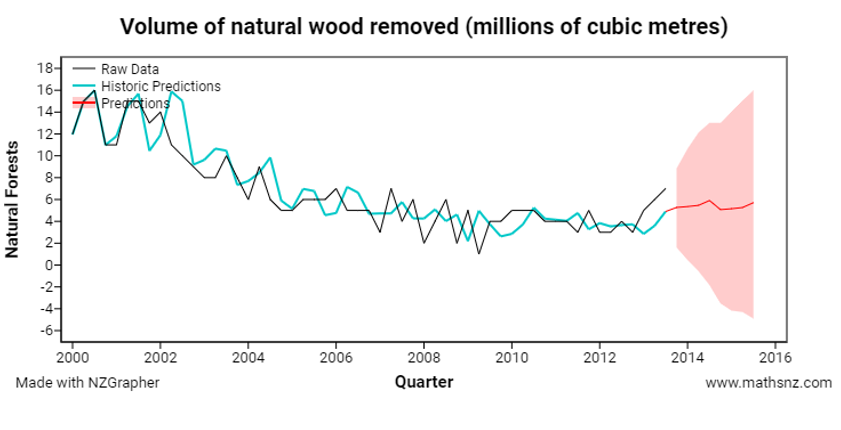
By looking at the recomposed data I can see that the overall amount of logging of our natural forests is generally decreasing from about 14 million metres cubed on average in 2000 to approximately 6 million metres cubed in 2013. This seems to make sense as New Zealand's natural forests were cut down extensively by early settlers as the demand for farmland increased and the export of hardwoods accelerated to meet the demand for ship wood. (source - www.nzwood.co.nz/forestry/sustainable-forest-management-of-native-tree-species-in-new-zealand/)
The amount of logging is very small when compared to NZ's plantation forests (the total production of timbers from sustainable sources is, in 2008, low. About 25,000 metres cubed (standing tree volume) or less are felled annually, comprising podocarp like rimu, beech and tawa, all species that are high-quality furniture and finishing timbers. There is an approved annual sustainable harvest of beech (particularly red and silver beech) that is significantly higher than the present national production of about 15,000 metres cubed. (source - www.nzwood/forestry-2/sustainable natural forests). Compare this to logging volumes were of the order of 18000 million meters cubed in exports to China alone in 2018. (www.mpi.govt.nz/export data by country).
Seasonal Pattern
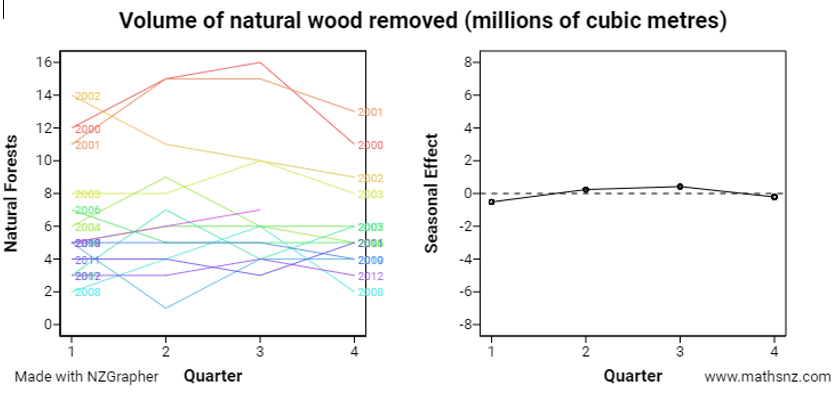
The largest amount of logging of natural forests occurs around the third quarter of the year, which is July, August and September. This is equates to about 0.5 million metres cubed above the long term trend. The minimum amount of logging occurs in the first quarter, January, February and March which equates to about 0.5 million metres cubed below the long term trend. However, there are many years where this pattern does not occur. Referring to the above left hand seasonal graph the minimum and maximum logging values peak in different quarters across the time frame measured. This indicates that trees tend to be logged as they mature rather than a fixed season of the year. The graph also shows the decline in logging as time has progressed. This is supported by MPI data for indigenous forests and others source - .The arrival of Europeans and the selection of land for farming where indigenous timber was dominant, resulted in forest removal and utilization of timber for construction and fencing. In 1993 the forest act of 1949 was amended to bring an end to unsustainable harvesting and clear felling of indigenous forests - (source - www.NZwood.co.nz).
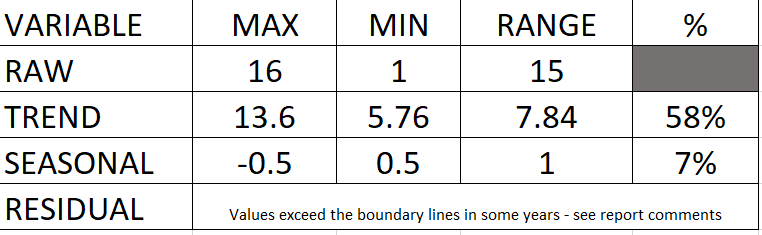
The downward trend contributes to about 58% of the total variation in the amount of natural forest logging in millions of metres cubed, from 2000 to around 2009. There has been a slight increase in logging, from about 4 million metres cubed in 2012 to about 6 million metres cubed in 2014. In comparison, the seasonal component contributes only about 7% of the total variation in the series. This suggests that the stage (time) of the year has little or no influence on the amount of logging of our natural forests. Looking at the residuals graph there many points where the data has dipped above or below 10% of the trend. This occurred around 11 times from 2000 to 2009.
Based on the results of the residual graph I wouldn't have a lot of confidence about the model that NZGrapher is using for this data set. However, I notice that from the middle of 2009 onward, the residuals stay within the 10% boundaries. This suggests that the model could be used to predict future trends but only based on the last 4 years of data. Further analysis will prove that this is not the case. Some of my research however, appears to support this line of reasoning.
Firstly, there is a demand for NZ natural hardwoods such as totara, kauri and beech from the USA and Europe. NZ legislation by government in the 1990's has resulted in an initial decline of natural timber logging. Secondly, since sustainable management plans have been implemented, there has been a gradual increase in logging. These amounts however are very small when compared with NZ plantation forests mainly of the pinus radiata species. In summary I would say that NZGrapher may not accurately predict logging volumes year by year but the actual trend in increasing volumes is detectable. (sources - NZwood.co.nz, MPI export data.Totara establishment and growth by David Bergin Forest Research Rotorua - 2003).
Appropriateness of the model (does the model that NZGrapher uses fit the data?)
Overall the model doesn't fit the data particularly well. This was because of the highly variable nature of the seasonal graph. The first two years (2000 - 2002) aren't too bad. However, apart from possibly 2005 and 2011, there is little correlation between the raw and historical predictions. But the overall decreasing trend is clearly visible and slightly increasing trend from 2012 on. As previously discussed, the governments strict control since the 1990's protecting indigenous forests from logging has had a marked affect by drastically reducing total logging volumes. Allowing private landowners to continue with sustainable management plans has allowed small quantities to be harvested to meet a potential overseas and domestic market.
Overall the model doesn't fit the data particularly well. This was because of the highly variable nature of the seasonal graph. The first two years (2000 - 2002) aren't too bad. However, apart from possibly 2005 and 2011, there is little correlation between the raw and historical predictions. But the overall decreasing trend is clearly visible and slightly increasing trend from 2012 on. As previously discussed, the governments strict control since the 1990's protecting indigenous forests from logging has had a marked affect by drastically reducing total logging volumes. Allowing private landowners to continue with sustainable management plans has allowed small quantities to be harvested to meet a potential overseas and domestic market.
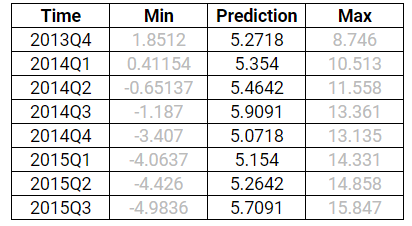
Making the prediction:
Referring to the table above I would predict that the amount of logging from natural forests in New Zealand in the 4th quarter of 2013 to be 5.27 million cubic meters. However, I would be more confident that it would be between 1.85 and 8.7 million cubic meters of timber.
I also would predict that the amount of logging from natural forests in New Zealand in the 3rd quarter of 2015 to be 5.7 million cubic meters. However, I would be more confident that it would be between -5 and 15.8 million cubic meters of timber. The -5 value is an indication that the model is not coping with the prediction very well.
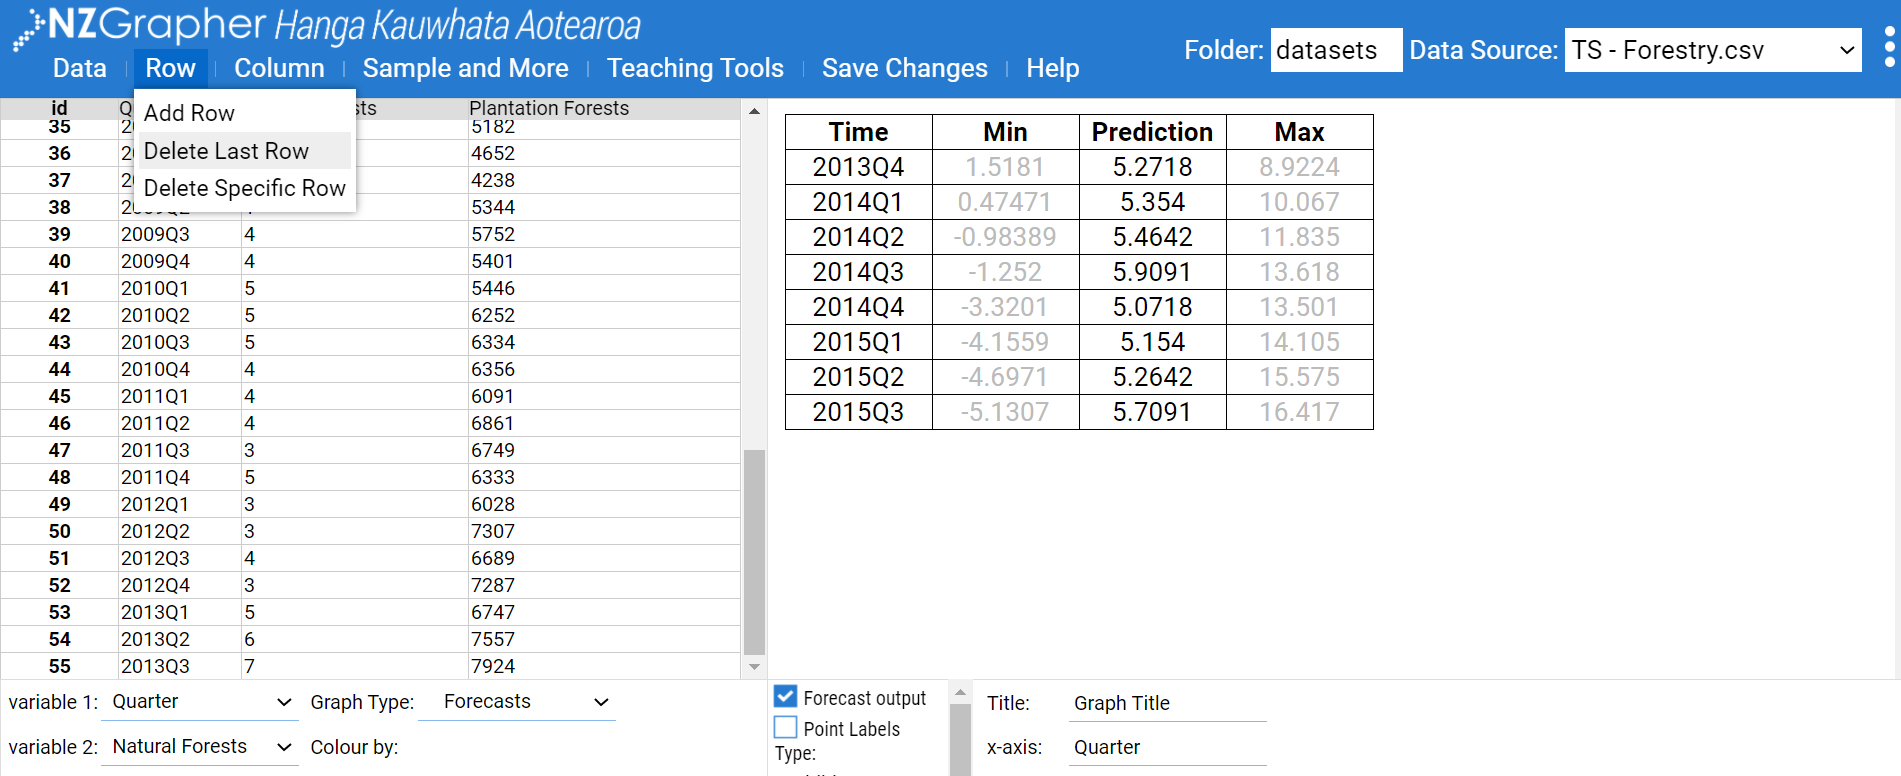
To further test the confidence of the model we remove the last 3 rows of raw data and the forecast table will automatically update. We then see how much the predictions have changed by as a percentage. You can remove 4 rows if it represents a whole year but we will remove three in this example.
To do this go into NZgrapher, click on the ROW tab and delete the last row three rows, one at a time. In this case this represents the three quarters of 2013. The new table will automatically update. Copy the new table into your report next to the original forecast table.
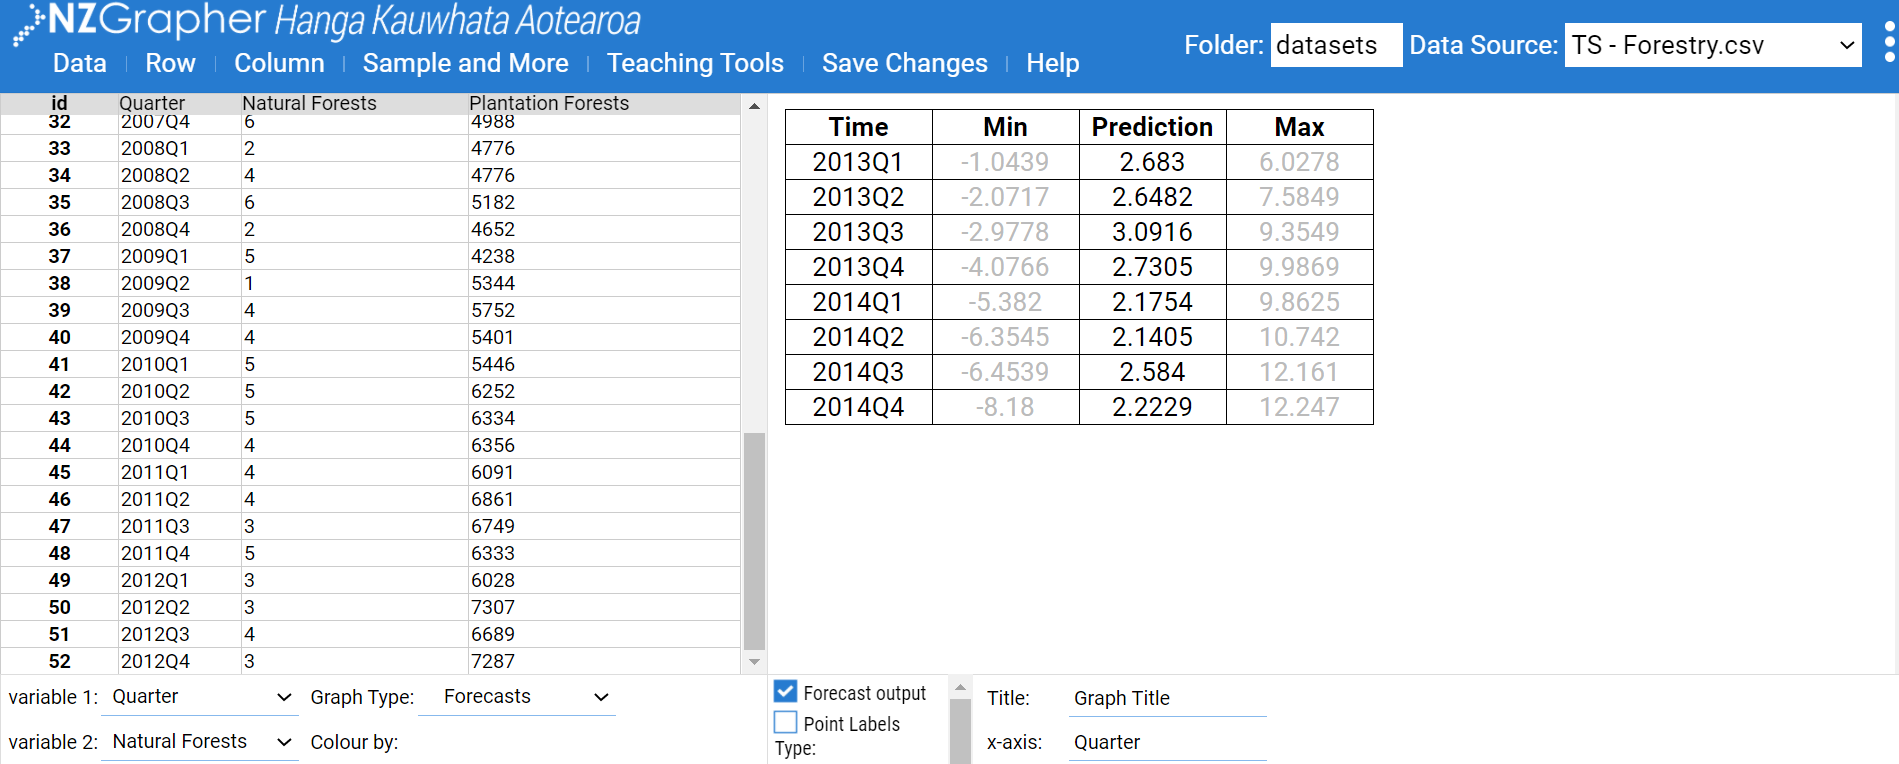
This gave us differences of _________________. This is quite a large/small percentage difference which indicates that the NZGrapher model is not fitting/fitting the raw data very well. Therefore, the model predictions will not be accurate as individual values but the upward trend is still identifiable.
The research previously indicates that the demand is there. The state of the economy in terms of exports, coupled with political interference could be contributing factors affecting overall volumes. One aspect not discussed so far is the economy and its effect on logging of both plantation and natural forests. Management of native trees can maintain quality with respect to log size and branching, however reputations of timber quality have largely been built up on utilization of heartwood from old-growth stands. Heartwood and many other wood properties are largely age
dependent and may be compromised if economic considerations dictate shorter rotations. In other words to make profits from forestry, quality trees need to be grown quickly for fast turnaround. This is currently not possible with New Zealand indigenous timbers which can take 60 to 100 years to reach quality maturity. (source - Proceedings of Native Tree Forum, University of Waikato, Hamilton 8-10 October 1999 quality native timber from future managed stands - Don McConchie
Forest Research, Rotorua)
Conclusion:
In conclusion there appears to be a definite decrease in the volume of logging being carried out in New Zealand's natural forests from about 13.6 million metres cubed in 2000 down to about 6 million metres cubed in mid 2013. This should encourage environmentalists that the policies of previous governments have absolutely put the brakes on indigenous logging. From an economic viewpoint the amount of logging is still very small when compared with NZ's plantation forests,
about 6/18000 or 0.03% of logging by volume. Environmentalists should also take heart that the government has placed very strict regulations on private landowners to make them accountable for any native logging that may occur on their lands. (www.mpi.govt.nz, Don McConchie 1999)
There has been a slight resurgence in the logging of native timbers and a detectable rising trend is evident since around 2013. This is likely due to an increase in demand for native NZ timber overseas in countries such as the U.S.A, Australia and Japan and sustainable management logging from private land owners to meet that demand. This is encouraging news for business export opportunities, especially those in a niche market for high end NZ hardwood products in kauri and rimu furniture and kitchen design and build.
The research above and that embodied in this report appears to follow that predicted by NZGrapher. This may not be accurate in terms of year by year but certainly follows the general trend. Other factors not discussed in this report which could impact on this data negatively or positively would be possibly future government policy and economic uncertainty which currently exists such as trade stalls between China and the USA, both of which are current trade partners with NZ. Uncertainty leads to lack of investment for which businesses need to develop and become sustainable. [no new material should appear in the conclusion so this last paragraph should have been discussed in the body of the report with sources].
