
Height vs Armspan Bivariate Investigation
Problem: I have noticed that when a person is tall, they seem to have larger armspans than people that are shorter. This seems logical because the height of someone should affect the size of other body parts.
My investigative question is “Is there a relationship between armspan and height?”
PLAN:
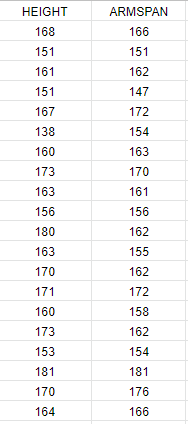
We measured the heights and armspans of all the students in our class which had a sample size of 20. Students were put into groups of 3 and each person in the group was assigned a specific role such as measuring and recording. My responsibility was to record the group results and showing the data to the teacher. I then pasted the data file (spreadsheet) into NZGrapher to create a scatter graph.
Manage sources of variation.
To measure height we used a tape measure that was set from the ground and extended up the flat wall. To manage sources of variation each student took off their shoes and then stood straight with their heels against the wall with their back straight. Another student used a flat object to place on the students head to see their height then record it off the tape measure after it was pulled up tight. We measured to the nearest cm.
Armspan was also measured with a tape measure which was pulled from middle finger tip to middle finger tip with outstretched arms being held horizontal to the ground.(Not including nail). Each student placed one arm against the wall to help manage sources of variation. Again this was measured to the nearest cm.
Problem: I have noticed that when a person is tall, they seem to have larger armspans than people that are shorter. This seems logical because the height of someone should affect the size of other body parts.
My investigative question is “Is there a relationship between armspan and height?”
PLAN:
We measured the heights and armspans of all the students in our class which had a sample size of 20. Students were put into groups of 3 and each person in the group was assigned a specific role such as measuring and recording. My responsibility was to record the group results and showing the data to the teacher. I then pasted the data file (spreadsheet) into NZGrapher to create a scatter graph.
Manage sources of variation.
To measure height we used a tape measure that was set from the ground and extended up the flat wall. To manage sources of variation each student took off their shoes and then stood straight with their heels against the wall with their back straight. Another student used a flat object to place on the students head to see their height then record it off the tape measure after it was pulled up tight. We measured to the nearest cm.
Armspan was also measured with a tape measure which was pulled from middle finger tip to middle finger tip with outstretched arms being held horizontal to the ground.(Not including nail). Each student placed one arm against the wall to help manage sources of variation. Again this was measured to the nearest cm.
Analysis
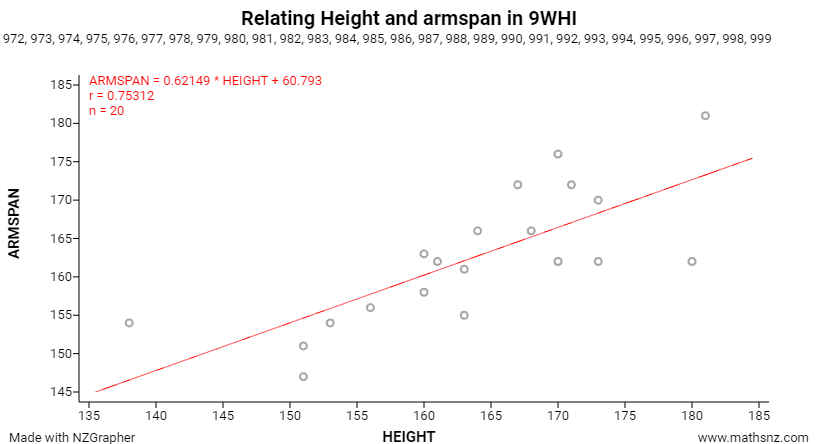
Looking at my graph, I notice that there is a positive relationship between height (cm) and armspan (cm) of the students in 9WHI. This is because the trend line has a positive gradient (sloping upwards). The strength of the relationship between height and armspan is strong, because most of the dots (data points) are close to the trend line. This makes sense because taller people seem to have longer armspans. The tallest person has the longest armspan.
Conclusion:
The results show that there is a positive and strong relationship between student height and armspans in 9WHI. This makes sense because people that are taller tend to have longer armspans.
