
BIVARIATE DATA
Government Excellence Example
(Unfortunately they don't use TASGUS like in a formal report- it just shows the minimum standard for an excellence report)
For Excellence, the student needs to investigate bivariate numerical data using the statistical enquiry cycle, with statistical insight. This involves integrating statistical and contextual knowledge throughout the statistical enquiry cycle and may involve reflecting on the process or considering other explanations for the findings. The evidence comes from the TKI assessment resource ‘Bivariate Smorgasbord’. The student has planned and conducted an investigation using bivariate numerical data by working with a given relationship question (1), determining appropriate variables and measures (2), and managing sources of variation (3). They have also gathered data (4) and selected and used appropriate displays (5). The student has also communicated the relationship in the data, including the strength and direction (6). The student has integrated statistical and contextual knowledge (7). There is reflection on the process (8). For a more secure Excellence, the student could strengthen the contextual discussion and reflection on the process. For example, the student could consider what effect different varieties of carrots could have on the relationship.
Student report
My Investigation
What is the relationship is between the length of a carrot and the weight of carrot? I am interested in this because when I went to the plant centre with my parents last week to buy some seedlings to put into our vegetable garden, my mum got talking to one on the staff members who made the comment that there are several types of carrots that can be grown and each carrot has different properties. The most common variety that most people associate with carrots is called a Danver. These are the carrots that are long and skinny which taper to a point and are typically orange in colour. However, the Imperator carrot is the one that is commercially grown and are found in supermarkets. These carrots are similar looking to the Danvers but are thicker in width. As I want to see if there is relationship between the length and weight of a carrot if I got a mixture of these two carrots this could lead some groupings so when I run my experiment I will have to try and ensure that I get all the same variety.
What is the relationship is between the length of a carrot and the weight of carrot? I am interested in this because when I went to the plant centre with my parents last week to buy some seedlings to put into our vegetable garden, my mum got talking to one on the staff members who made the comment that there are several types of carrots that can be grown and each carrot has different properties. The most common variety that most people associate with carrots is called a Danver. These are the carrots that are long and skinny which taper to a point and are typically orange in colour. However, the Imperator carrot is the one that is commercially grown and are found in supermarkets. These carrots are similar looking to the Danvers but are thicker in width. As I want to see if there is relationship between the length and weight of a carrot if I got a mixture of these two carrots this could lead some groupings so when I run my experiment I will have to try and ensure that I get all the same variety.
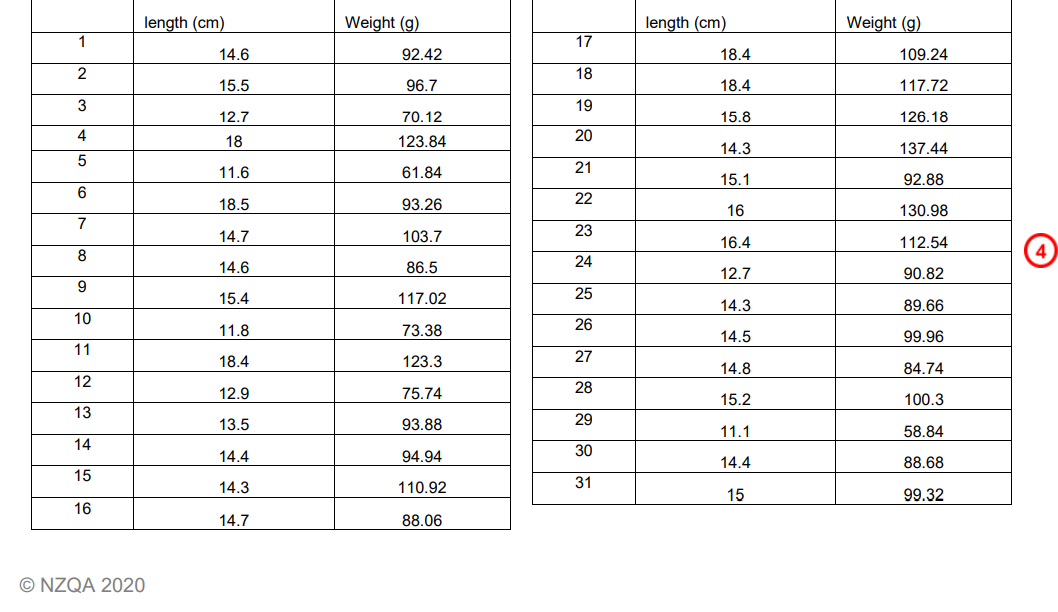
Before measuring the carrots, we are going to ensure that we have just one variety, as the carrots have been purchased from a supermarket in 1.5 kg bags I can be confident that the variety is Imperator carrot as this is the carrot sold in supermarkets. I will place the carrot straight and flat against the surface of the table. I will use a piece of string to measure the length and then transfer the length of string onto the 30cm ruler this will ensure if the carrot has slight curve this will still give a more accurate measurement of the length. I will measure from the very bottom of the carrot to the top just before the leafy bit and will try to ensure that the piece of string is straight up from the bottom to the top to the carrot and not being measured on an angle as this would increase the length of the carrot and could create errors and the leafy bit would also increase the weight of the carrot. Also, if there is any leafy bit is remaining, I will remove it before I measure the carrot. When using the piece of string to measure the length I will tie a knot at one end and use this end as the starting point for my measurement. The other end of the string I will hold with my thumb nail and then transfer the length onto the ruler. I will then place the carrot onto the scales to get the weight. I will ensure that each time I take the weight I will reset the scales back to zero. I will also ensure that the carrots I measure are all reasonably straight to start with as this will allow me to pull the string tight if they are bent finding the length of carrot would be more difficult. Any broken carrots we will not measure, and we will select another carrot from the bag. To make this a fair test we have one person measuring the carrots this way any error that occurs in the measurements will be consistent. Also as some carrots will look very similar to others when we have measured the carrot the carrot will have a sticker placed on it stating the number order it was measured and weighed this way we don’t re measure or re weigh the same carrot but also if we get a very different result we can go back to the carrot and re measure or re take the weight to ensure the result was appropriate. The number of carrots is 31.
Teacher note: TASGUS is scattered somewhere in here...
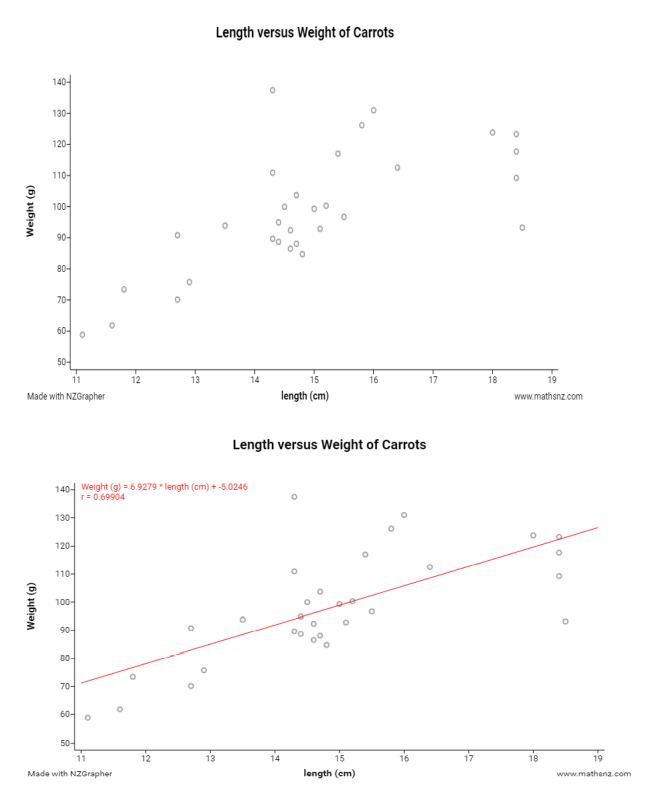
The graph shows that if the length of the carrot increases then the weight tends to increase also. I expected this because if a carrot has a is longer the weight of the carrot is also greater this is usually because not only is the carrot longer but also the carrot is usually wider. This is also supported with my own knowledge of baking carrot cake that while the recipe askes for 3 carrots usually if I have two larger carrots this is more than enough. This has been shown in my graph because the trend line shows a positive relationship sloping upwards. Most points are relatively close to the line of best fit, so I think the relationship is a strong one. There is also some clumping around the length of carrots from approximately 14.5cm to 15.5cm also there are 4 points around 18.4cm which have similar lengths but have different weights. There one point a far distance from the line of best which had a weight of 137.4 g and the length was only 14.3 cm but this carrot still fits the trend.
Something which could possibly impact on the relationship could be the age of the carrot. From experience I know that as the carrot get older in the vegetable chiller in the fridge the carrot tends to lose its moisture/sugars and shrink. This only however has an impact on decreasing the weight but not the length. I also noticed that when you buy a bag of carrots at a set weight, for example, 1.5 kilograms from the supermarket not all the carrots are the same length. I found out that as they are priced on weight the carrots are selected to be as close to the given pre weighed bag as possible. I was also told that none of the pre weighed bags are less than the specified weight this is because of the Consumer Guarantee Act. Also, the growing conditions could have an effect for the length of the carrot
