
2023 Bivariate Data
Height and Armspan investigation
Simple Version
problem:
I notice that boys on the basketball court with long arms and legs are usually quite tall. Also looking around my class, I don't see shorter students with long arms and legs. That would look strange as our bones usually grow in proportion to our height. I would like to investigate this further.
My question is: I wonder if there is a relationship between height and armspan of the students in my class.
My question is: I wonder if there is a relationship between height and armspan of the students in my class.
plan:
Measurement:
To measure the heights of students we will use a fixed vertical ruler on the wall positioned 1 m above the floor. This is called the height measuring station. A tape measure will be used to measure armspan.
To manage sources of variation (being consistent) in height measurement, our group will:
1) Shoes off, feet flat on the floor, standing straight, (to remove error due to differing sole thickness).
2) measuring to the nearest cm
3) Use a book, level on top of the head to ensure a correct reading.
To manage sources of variation (being consistent) with armspan, our group will,
1) Have arms spread out wide and level, middle finger of one hand touching the wall to make measuring easier.
2) Use the tape measure, measure from middle finger to middle finger, (not the nails) to the nearest cm.
The variables:
The height variable of students in cm is recorded on the x axis of the graph (horizontal axis) and the armspan variable of students in cm, on the y axis (vertical axis) in cm.
Sample size:
There are 27 students in our sample. (This is enough, because we only need 25 to 30 students in our class for an appropriate sample that can be used to represent a larger group of students such as YR9 at our school)
data:
analysis: T-A-S-G-U-S
Trend:
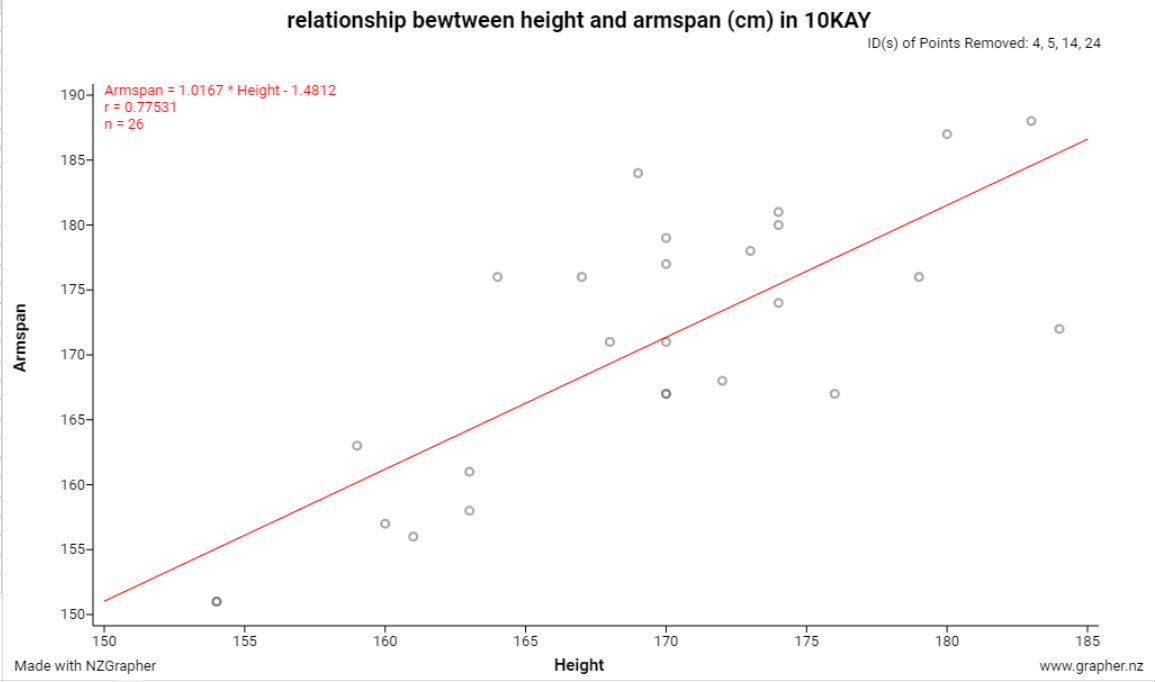
Looking at my graph, I notice that there is a linear relationship between height (cm) and armspan (cm) of the students in my class. This is because the data points form a line with a gradient.
Association:
I can see that the association is positive because the trend line slopes upwards from left to right, so as the heights of students increases so does their armspan.
Strength:
The relationship is moderately strong, this is because the data points are scattered not too far away from the trend line.
conclusion:
From my investigation, based on the sampled data we collected, I notice that there is a strong positive linear relationship between the height and armspans of students in my class. This shows that as the students increase in height, the armspans increase in length. I am not surprised by this because I was expecting the linear relationship as we grow in proportion.
