
Correlation guide for students
A number of colleges and learning institutions give different meanings to the value of the correlation constant. This guide shows how wide the gap can be and allows for quite a bit of overlap with the trend line gradient. For negative slopes add negative signs to the table.
Strong r = 0.5 to 1.0 or 0.8 to 1.0
moderate r = 0.3 to 0.5 or 0.6 to 0.8
weak r = 0.1 to 0.3 or 0.4 to 0.6
none r < 0.1 or 0 to 0.4
Strong r = 0.5 to 1.0 or 0.8 to 1.0
moderate r = 0.3 to 0.5 or 0.6 to 0.8
weak r = 0.1 to 0.3 or 0.4 to 0.6
none r < 0.1 or 0 to 0.4
l1 BIVARIATE DATA 2
Term 4 2020
PROBLEM
be careful if you are using a different variable in your report!
If your assessment has an introduction type investigation statement. You should link your conclusion back to it after you have completed your report. In this case the statement made was with reference to:
...the length of the outspread arms is equal to the height of a man.
Except here we are looking at popliteal of course and doesn't quite work out the same as armspan. You may also need to mention the age range you have investigated as the leading statement refers to a man.
...the length of the outspread arms is equal to the height of a man.
Except here we are looking at popliteal of course and doesn't quite work out the same as armspan. You may also need to mention the age range you have investigated as the leading statement refers to a man.
Introduction:
I notice that boys on the basketball court with long arms and legs are usually quite tall. Also looking around my class, I don't see shorter students with long arms and legs. That would look strange as our bones usually grow in proportion to our height. I would like to investigate this further. The popliteal is the distance from the ground to under the knee when the leg is at 90 degrees. I will investigate the length of the popliteal and see if there is a relationship between the popliteal and height.
I notice that boys on the basketball court with long arms and legs are usually quite tall. Also looking around my class, I don't see shorter students with long arms and legs. That would look strange as our bones usually grow in proportion to our height. I would like to investigate this further. The popliteal is the distance from the ground to under the knee when the leg is at 90 degrees. I will investigate the length of the popliteal and see if there is a relationship between the popliteal and height.
I wonder if there is a relationship between the height (variable 1) and the popliteal (variable 2) of students of Year 10 at Henderson High School in 2020.
PLAN
I wonder if there is a positive relationship between height (variable 1) and popliteal (variable 2) for students of Yr10 at Henderson High School in 2020.
Our group investigated the relationship between height (variable 1) and popliteal (variable 2) for students at Henderson High School in 2020. Before we took the measurements and recorded the data we tried to understand the challenges, the typical values we might expect and managing the sources of variation.
Our group investigated the relationship between height (variable 1) and popliteal (variable 2) for students at Henderson High School in 2020. Before we took the measurements and recorded the data we tried to understand the challenges, the typical values we might expect and managing the sources of variation.
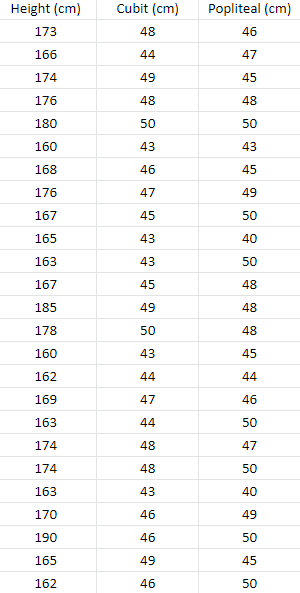
Measurement:
To measure the heights of students we attached a ruler on the wall positioned 1 m above the floor.
To measure height every student had to take off their shoes and the measurement was taken at the tip of the head to increase the accuracy of measurement.
To measure popliteal, a plastic folding carpenters ruler was used. The students had to sit upright in a chair with their legs at 90 degrees, shoes off and feet flat on the floor.
Scale values: Measurements for height and popliteal were to the nearest cm. Half cm readings were rounded up.
Challenges: Measuring with the carpenters ruler for the popliteal needed some practice and some students had to take the measurement again.
Manage sources of variation: I managed variations by making sure students removed their shoes and their heads were not covered or there were no hair styles that would make the height measurement wrong I also made sure the ruler used in popliteal measurement was held against the floor and at 90 degrees. Finally I made sure that our measurements were accurately matched to the students in my group.
My role during measurement was to take accurate measurements/record values called out by the measurer. After recording the measurements on paper, I gave them to the teacher where they were put on google classroom. I then copied them into NZGrapher to create a scatter plot to study the relationship.
DATA
ANALYSIS
Trend
Association
Relationship
Scatter
Unusual
Groups
Trend: (linear/non-linear)
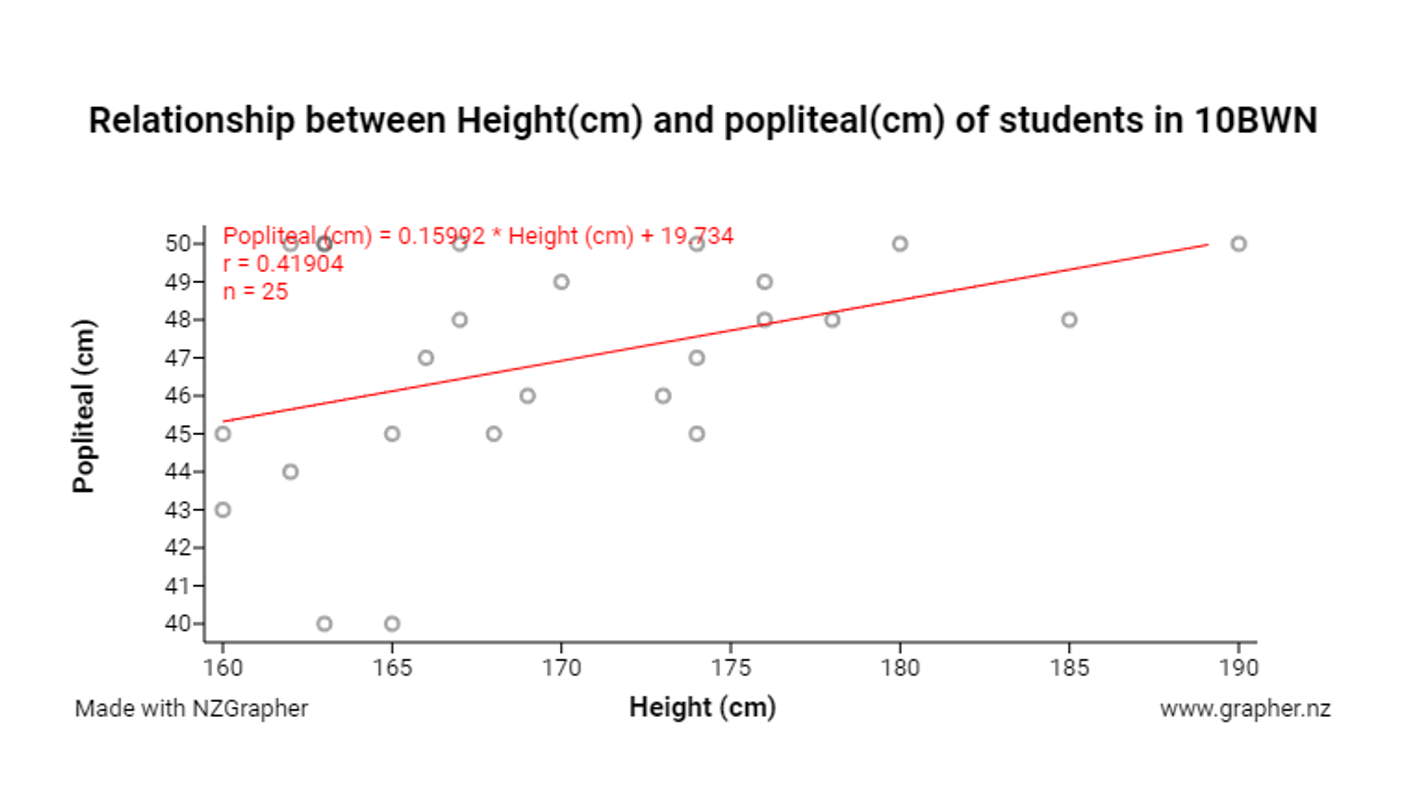
From the graph I can see there is a positive linear relationship between the heights and popliteal of students in 10BWN. This makes sense because as we grow our bones grow in proportion to each other.
Association:(Positive/negative slope)
I can see that the association is positive because the trend line slopes upwards which means that as the heights of the students increases so does the length of their popliteal. The value of slope is taken from the equation of the line in NZGrapher which is in the form
y = mx + c
popliteal = 0.16 x height(cm) + 19.7
This means for each increase in height of 1cm, the popliteal increases by 0.16cm because m is the rate of change or slope of the line. Since the R value should be 1 for a perfect model, 0.4 is quite low and so doesn't represent a very good 'fit'.
Strength:(scatter plots close or spread away from the trend line)
I notice that the data points are grouped quite loosely around the trendline, some are close but others are far away. This means that the relationship between height and popliteal is moderate to weak especially when we look at the R value given in NZGrapher.
Groups/Clusters.
Most of the data points are spread across the middle of the graph between 165 and 180 cm. There are a few points below and above the main group. This means that there is quite a variation of students of different heights (tall to short) and different popliteal lengths in our class.
Unusual features:
There are two points at the top right of the graph and two points at the bottom left of the graph. For the two bottom students they would have shorter popliteal lengths compared to their height. Also the tallest student doesn't have the longest popliteal length compared with his height.
Scatter:
The scatter in the graph although spread across the trend line, does not give us a strong relationship. This won't give us a lot of confidence in interpreting our results or using the graph as a prediction tool.
Summary:
There is a positive relationship between height (variable 1) and popliteal length (variable 2).
Most people's hands are located in a similar position when we hang our arms along side our bodies. Our body parts grow in proportion according to the genetic code in all of us.
Variations:
We could explore other age groups as it is generally known that many people in their senior years tend to shrink and lose some height but their arms stay the same length. This means there is more variation if we take age into consideration.
CONCLUSION
After investigating my sample of data, I can say there is a weak to moderate linear relationship between height(variable 1) and popliteal length (variable 2) in YR10 students at Henderson High School. I am not surprised by this result as I expect that our bones grow in proportion as we grow in height. I learned this in school (or write where you learned it).
Because the trend line is sloping upwards, there is a positive relationship that as we grow taller, our popliteal lengths also increase. The slope of the trend line is 0.16 (m value). This means that for each cm we gain in height, our popliteal lengths increase by 0.16 cm.
Because the trend line is sloping upwards, there is a positive relationship that as we grow taller, our popliteal lengths also increase. The slope of the trend line is 0.16 (m value). This means that for each cm we gain in height, our popliteal lengths increase by 0.16 cm.
Improvements:
I could improve my investigation by measuring student height more accurately, including checking (quality control of the measurement processes) regarding errors due to shoes, hair length and accessories. Also the sample size of our class which is supposed to represent all YR10 students is quite small at 22 samples. Therefore, we should collect more data, say combine two classes to improve the accuracy of our investigation.
Other investigations:
Our results may not represent the whole population of NZ, just YR students in NZ schools. This is because older people tend to lose a little height as they age but arms and legs tend to stay the same length. Young children like toddlers tend to have large heads and bodies compared with their arms and legs. So they may have a different ratio of height to popliteal length than our class. This means we should include a sample from all age ranges to reflect what is happening in the population.
END (yeah!)
