
MAKING THE CALL
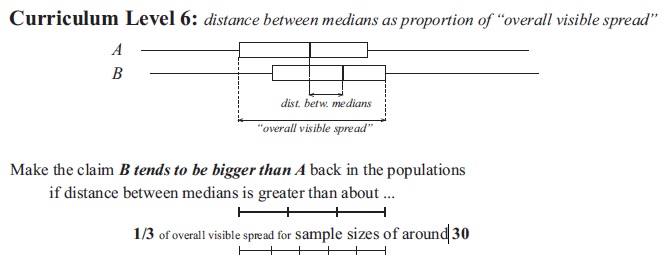
In YR11 (curriculum Level 6) you may remember using the 1/3 rule for making the call as to which group of the population was taller/longer etc. The rule is summarised in the following diagram. For B to be larger than A, the distance between the medians compared to the distance between the overall spread has to be greater than 1/3 or 33%.
In YR12 (curriculum Level 7) we use a different approach, a formula based method that allows us to make a call using a confidence interval. You will recall that everyone who took a sample in the practice activities got different 5 number summaries though they may have been similar. So we have a class of students with lots of different medians representing the so called population median. So to get around this problem you use your sample information to provide a range of values within which the population median most probably lies. This is called a confidence interval. The formula used to obtain this interval in YR12 says we can be 90% confident that our population median lies inside it. The interval is drawn as a symmetrical horizontal line across each median bar of the boxplot (the blue bands). If the intervals overlap, we can't make the call and if there is a gap between the lines we can.
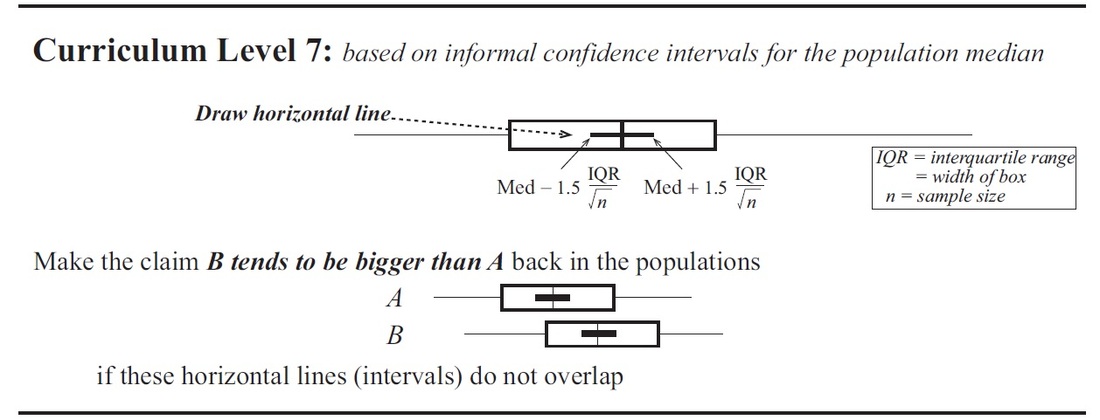
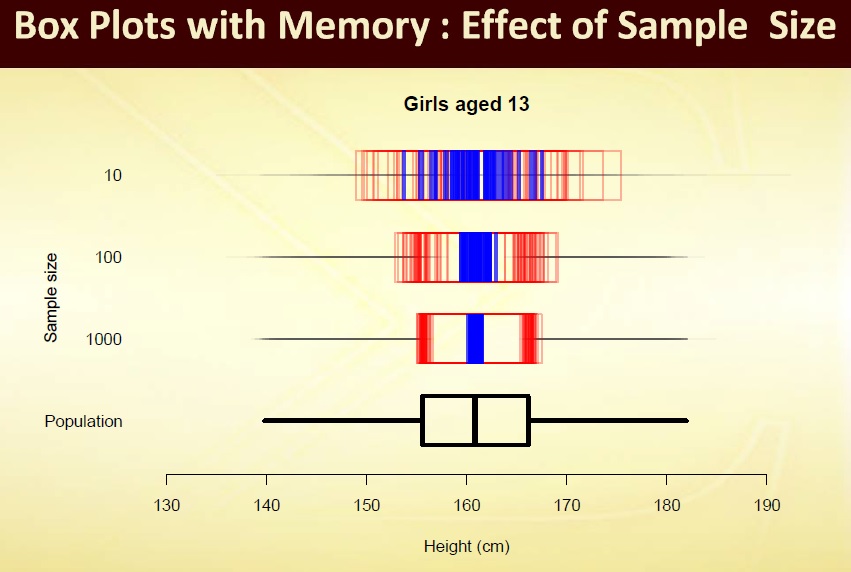
What you are calculating is the width of the blue band in the diagram below. The blue band or VARIATION will depend on the size of your sample and the IQR of the box.
Let's go back to our example on Auckland and Taupo Tourest dollars and make a call based on the informal confidence interval.
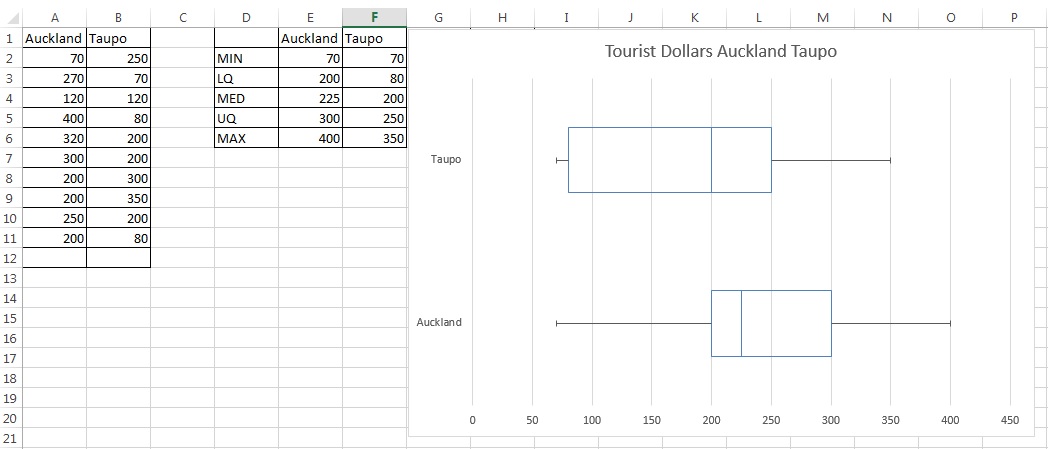
There are 10 samples from each destination. Remember that 10 samples is not sufficient to carry out a proper investigation, you need at least 30 and you will take 50 samples for the assessment. Calculate the IQR's for each destination and substitute into the formula. The formula will give a 90% probability that the true population median lies within the interval for each destination.
INFORMAL CONFIDENCE INTERVAL CALCULATION PRACTICE
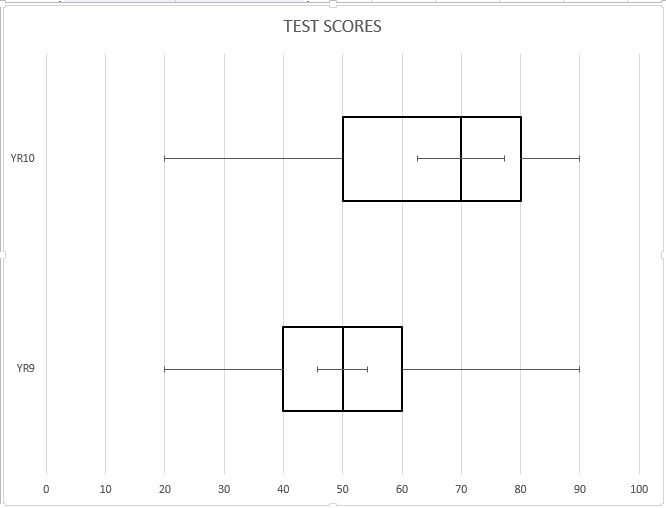
We are going to compare YR9 and YR10 math classes. 50 students from both years are randomly selected. All students sit the same assessment. I want to see which class has the highest median test score. I suspect the YR10 students will get better results because they are older and have more experience. I would like to extend this by suggesting that other YR9 and 10 classes at other schools might get similar results. The calculations are shown below along with the box plots.
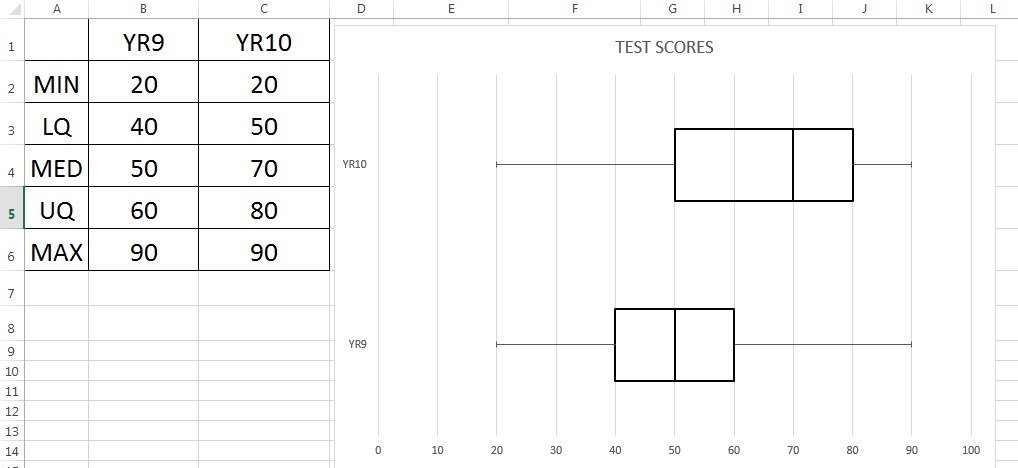
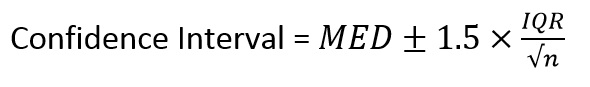
IQR represents the inter quartile range and n, the sample size (50 of each group). The median value for YR9 is 50 and the IQR = 60 - 40 = 20. Remember the interval calculation is added to and subtracted from the median value. So the 'bar' is a symmetrical horizontal line above and below the median - that blue band of variation you saw in the diagram above called boxplots with memory. So plug the values into the formula as shown here.
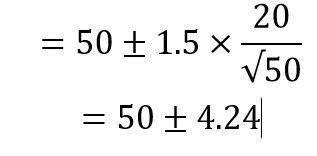
So the confidence interval will go from 4.24 below 50 to 4.24 above 50 or from 45.76 to 54.24 That's YR9 sorted. Now the YR10's.
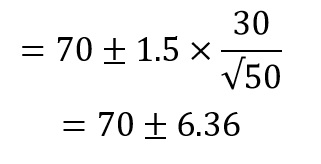
So the confidence interval will go from 6.36 below 70 to 6.36 above 70 or from 63.64 to 76.36 Once you have finished the calculations you can sketch the interval on your graph and make the call. To make the call there must be a gap between the line or data. If it's too close to see on your line use your data. Looking at the graph below you can clearly see that there is a gap between intervals. This means we can be 90% confident or pretty sure that the median test score for all year 9 and 10 students at school will fall within those intervals on the graph.
Practice writing (making) the call activity
You will get the following handout in class but the first box answer needs to be corrected. It's about armspans and not the lengths of girls index fingers! Just estimate the numbers by looking at the scales on the graph to the nearest whole number.
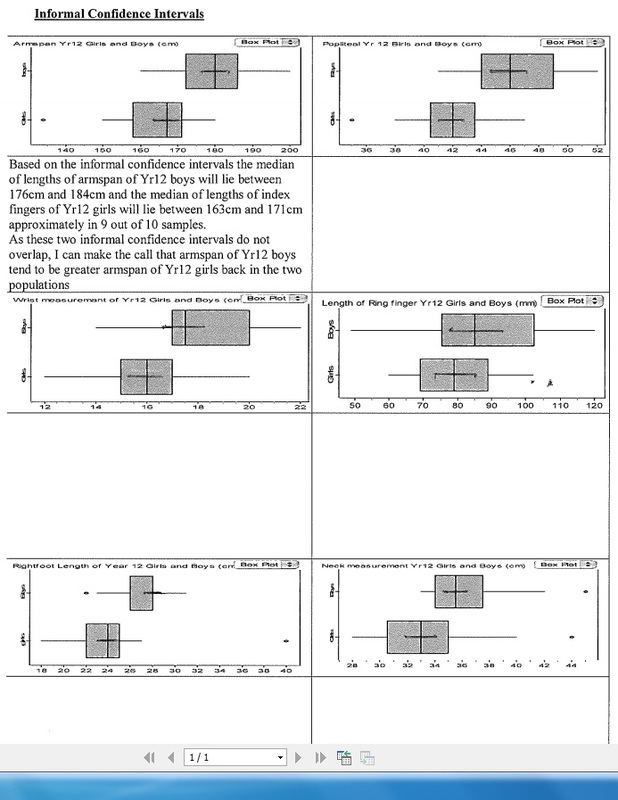
The following file allows you to practice writing statements in 'making the call'. You can down load the file here. The answers file is also here.
|
| ||||
Practice sampling part 2
In this second practice activity you will write a comparitive investigative question based on income using PPDAC as a guide. The database contains 200 records which will represent the population. You will take 50 samples of each gender, create 5 number summaries, sketch 2 boxplots and discuss features of your graphs. Comment on sampling variability and the variability of estimates. You will then make the call (or not make the call) as to which gender earns the most amount.
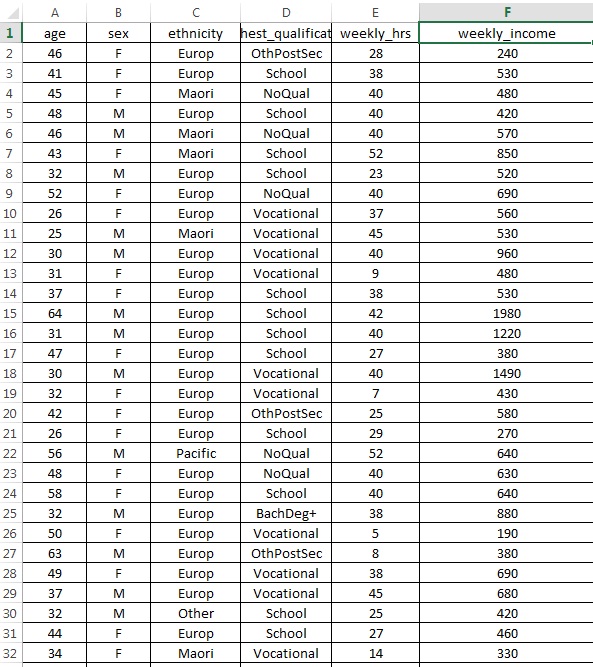
You can download the file here.
| copy_of_example_inference_data_200items_revised.xlsx |
