
Level 2 Graphing
practice 5
Exporting images using the image Exporter function
In this activity, find and describe the equations that model sections of the image and investigate creating a pattern by translating the original image. The second image must not overlap the original image. Comment on how the transformation affected equations of the original image.
Explain in general terms how changing the original image will change the equations to create the new image.
Explain in general terms how changing the original image will change the equations to create the new image.
Achieved:
Give at least 2 graphs and their domains. The two or more graphs must be of a different type.
Don't forget the domains in a statement!
Give at least 2 graphs and their domains. The two or more graphs must be of a different type.
Don't forget the domains in a statement!
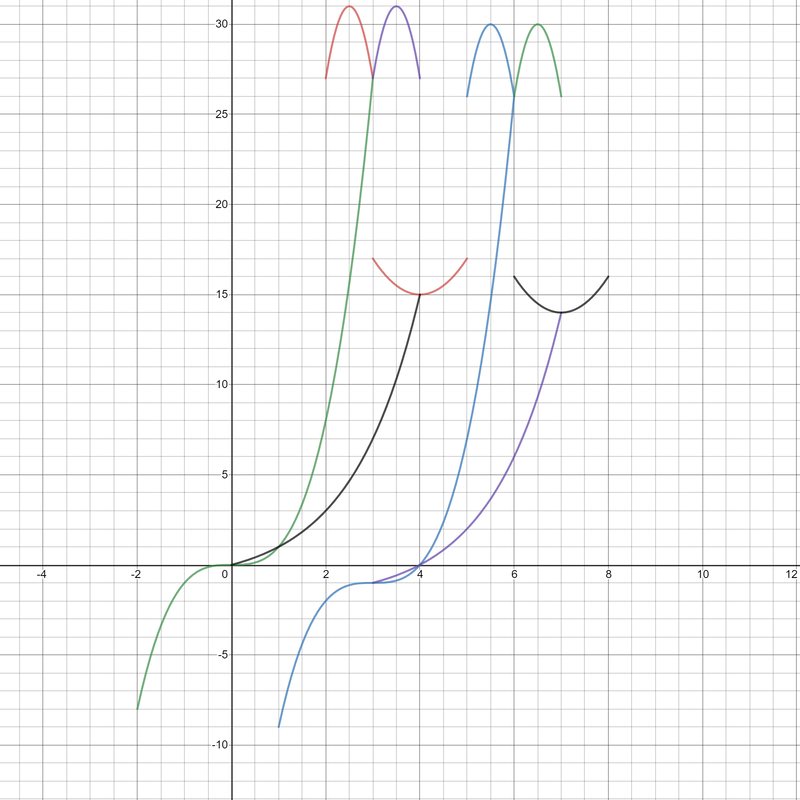
The second image Translated horizontally and vertically
(more than one solution is possible)
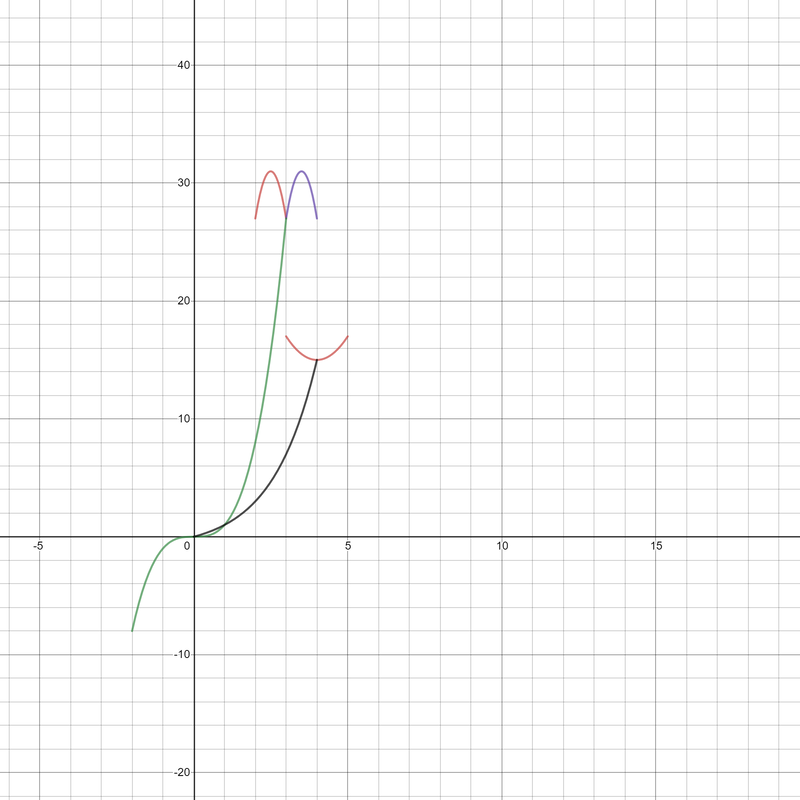
the equations
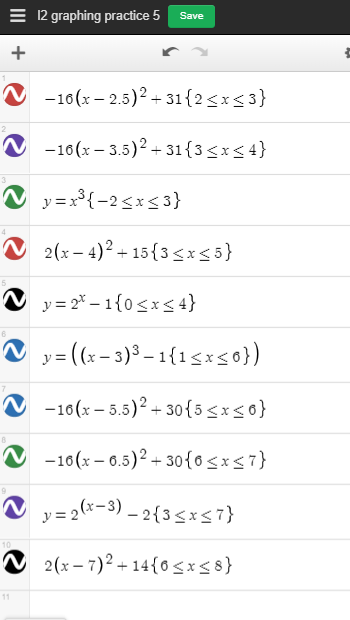
1) For the cubic graph (green), x is between -2 and 3
2) For the exponential graph (black), x is between 0 and 4
3) For the first inverted (concave down) parabola (red), x is between 2 and 3
4) For the second inverted (concave down) parabola (purple), x is between 3 and 4
5) For the positive (concave up) parabola (red), x is between 3 and 5
Merit:
Transform all parts of the original image horizontally and vertically with no overlap and state their equations.
"I have moved the original image 3 places to the right and 1 place down. For example, this changes the original equation of the first parabola as follows:
y = -16(x-5.5)^2 + 30 for x values between 5 and 6
The number inside the brackets has decreased by 3 and moves the image to the right. The number outside of the brackets has decreased by 1 and this lowers the image by 1 place.
The domains have increased by 3".
Excellence:
The following equations describe how the original image is translated horizontally by a factor of 'h' and vertically by a factor of 'v'
1) For the cubic graph (green), y = (x - h)^3 + v
2) For the exponential graph (black), y = 2^(x - 1 - h) + v
3) For the first inverted (concave down) parabola (red), y = -16(x - 2.5 - h)^2 + 31 + v
4) For the second inverted (concave down) parabola (purple), y = -16(x - 3.5 - h)^2 + 31 + v
5) For the positive (concave up) parabola (red), y = 2(x - 4 - h)^2 + 15 + v
