
graph shapes - features and distributions

For higher grades you need to discuss features in your graph. Your graph shape will depend on the outcomes from your experiment and will be linked to the number and colour of the cards in your pack. Try and match the shape of your graph to one of the examples above. The most common graph shapes that occur are:
Right and Left Skewing - where the data has a tail that trails off either to the left or to the right.
Normal Distribution: The shape of the graph looks like a bell and is often called the bell curve.
Uniform Distribution: This is where the data is equally spread out and doesn't have any peaks. If the graph has one or two peaks you can call it uniform except for where the peaks are.
Example: Describe features in the following graph.
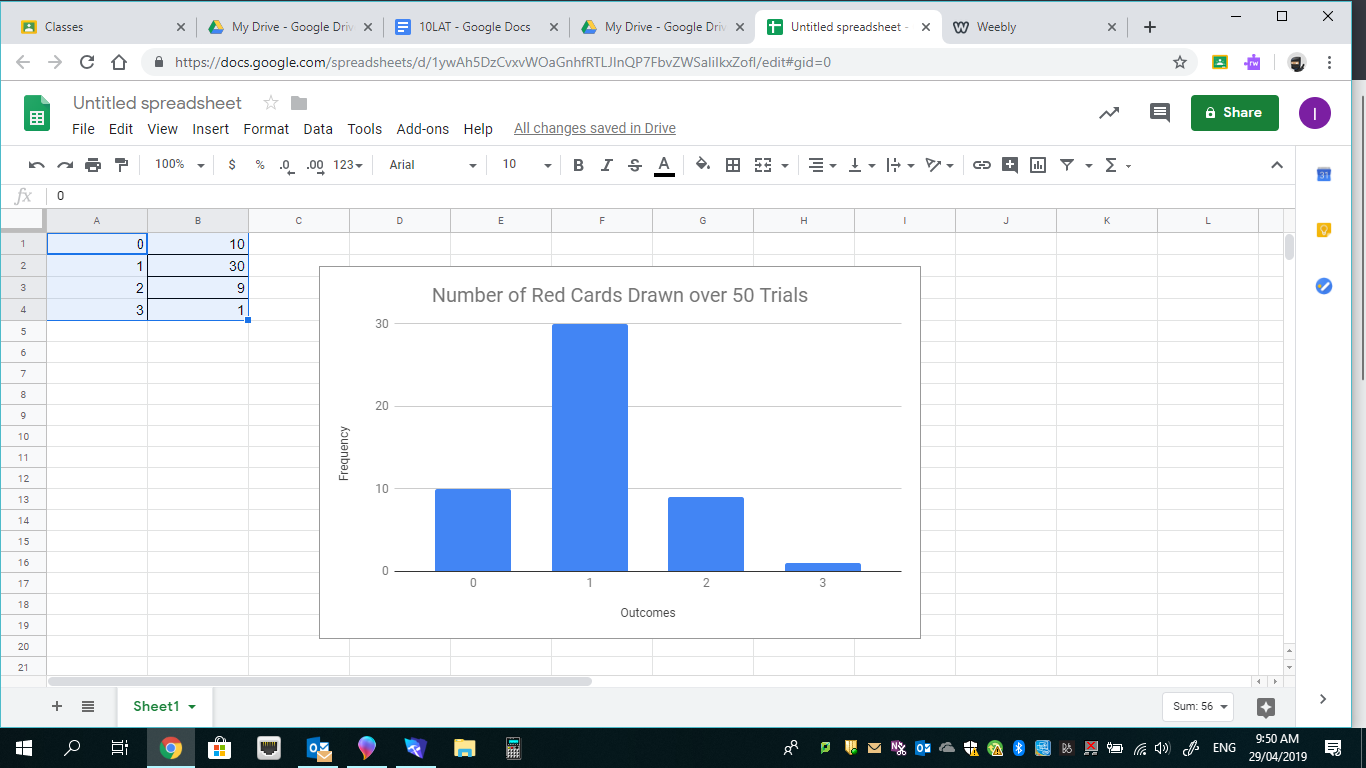
Looking at my graph and data I notice I got 1 red card the most. This happened ....
