
probability
3 RED CARDS
investigation
Major Graph Distributions

Excellence Example
PROBLEM:
I wonder how likely it is that I can draw 3 red cards from my pack of 10 cards. I expect it won't happen very much, perhaps it might happen once or twice in 50 trials.
I wonder how likely it is that I can draw 3 red cards from my pack of 10 cards. I expect it won't happen very much, perhaps it might happen once or twice in 50 trials.
PLAN:
I have 10 cards in my pack, 4 red and 5 green and 1 blue. I will shuffle the cards face down and turn up three cards at random. I will record the results in a table. I will then return the cards to the pack and reshuffle them. I will repeat this process 50 times. I will use the data to draw a bar chart. The possible outcomes are:
0 red cards
1 red card
2 red cards
3 red cards
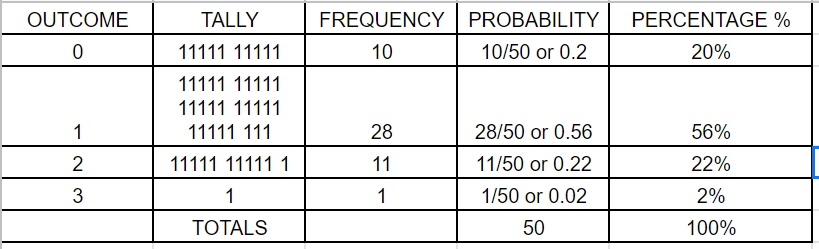
DATA:
Analysis
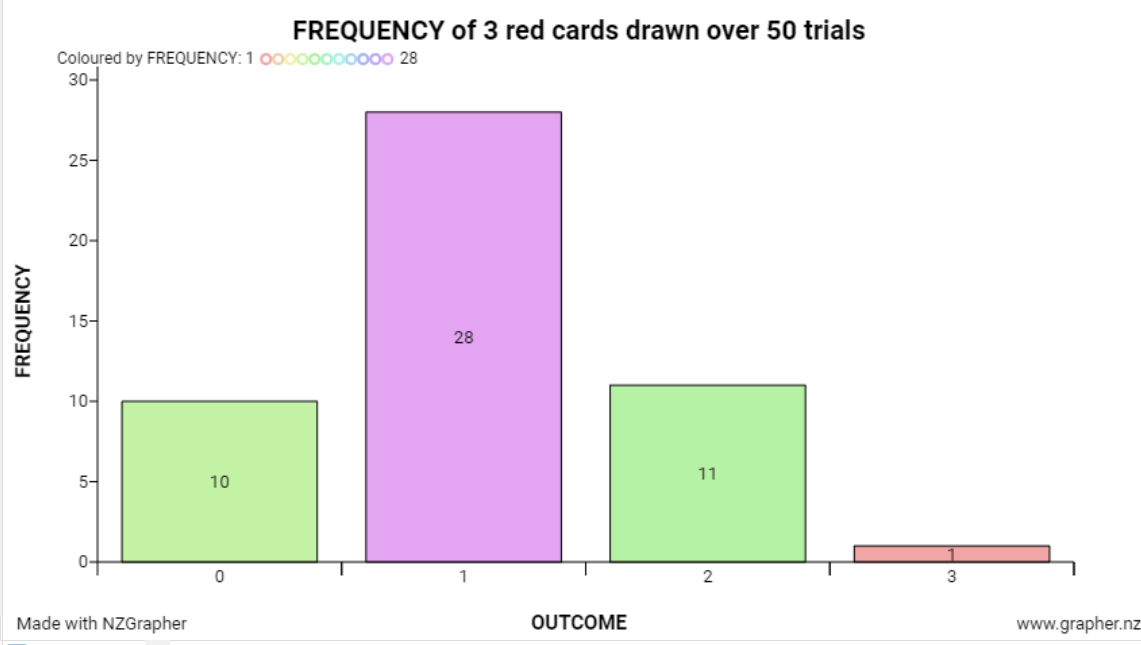
I notice that the most frequent result was getting 1 red card which was 56% of the time followed by 2 red cards 22% of the time. I got 0 red cards 20% of the time and 3 red cards only 2% of the time. The graph is skewed to the right because getting 1 red card happen more often than getting the other options, causing the tail to trail to the right.
I notice that the most frequent result was getting 1 red card which was 56% of the time followed by 2 red cards 22% of the time. I got 0 red cards 20% of the time and 3 red cards only 2% of the time. The graph is skewed to the right because getting 1 red card happen more often than getting the other options, causing the tail to trail to the right.
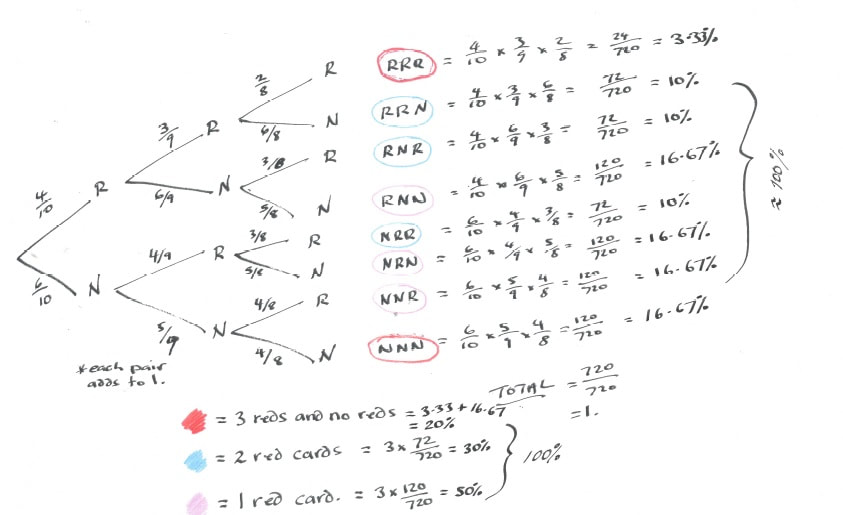
Theoretical Probability:
It is not necessary to draw out the whole table. However, listing the outcomes RRR, RRN, RNR is helpful.
Conclusion:
To answer my question I got 3 red cards once out of 50 which is 2%. My experiment shows me I am more likely to get 1 red card as an outcome than any other. Out of 50 trials this happened 56% of the time. However, choosing 2 red cards happened 22% of the time followed by no red cards which happened 20% and least likely was getting 3 red cards on 2%. This was no surprise as I didn't expect to get 3 red cards a lot in this experiment.
Theoretical
According to theoretical probability the chance of getting 3 red cards is 4/10 x 3/9 x 2/8 = 24/720 or 3.33% which translates to about 3 red cards at least three times. This also means that the probability of not getting 3 red cards is 96.67% (1 - 0.033 = 0.967). I drew 3 red cards only once out of 50 (2%) and that's a difference of 1.33%. However, I have only conducted 50 trials. This is quite a small sample size. If I repeated this experiment again with 50 trials I expect I would get similar results because my sample size is the same. Based on my experiment I would expect to get 3 red cards just once in another trail. However, I also suspect that if I conducted much larger trials, say 1000 or even larger, in the long run I would get results that approach the theoretical value of 3.33%.
Another reason why I didn't get a result close to the theoretical result might be the way I shuffle the cards on my desk. Perhaps I didn't shuffle them enough and that's why I selected slightly more red cards than expected.
