
SHARKS
Introduction
Globally shark populations are in decline and this needs to change if we want our oceans to remain healthy. Sharks need our help to protect them as well as the fisheries and ocean ecosystems which they keep in balance. Ministry of Primary Industries (MPI) aims for New Zealand to be recognised internationally for its efforts in shark conservation and management. It carries out research on sharks in NZ waters measuring shark lengths and weights as well as investigating the marine environment they live in.
question
My question is - I wonder what the difference is between the median lengths of male sharks and the median lengths of female sharks from the sample population at NZGrapher.
The variables I will investigate are the lengths of male and female sharks in cm. I will use measurement data that records the length of the shark from its nose to the tip of its caudal fin.
I will use the median (as opposed to the mean) as a measure of the average lengths as this is less affected by large (or small) extreme values or outliers.
data
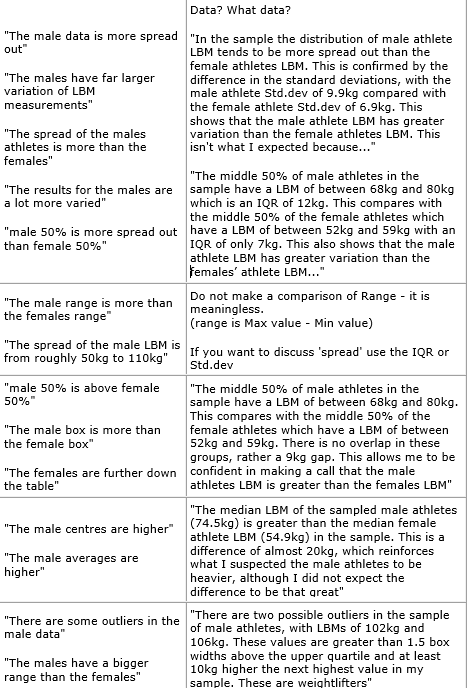
Helpful report hints for the analysis
analysis
Better comments can be found in the table on the right.
Central Tendency:
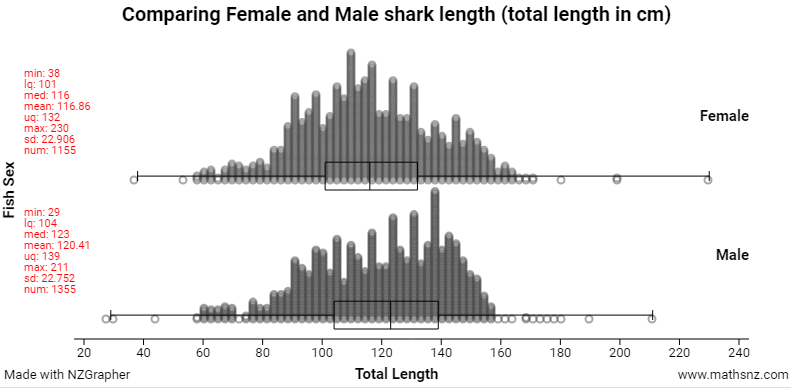
The median length for female sharks is smaller at 116 cm and the median length for male sharks is 123 cm, a difference of 7cm. This indicates that the average male shark could be longer than the average female shark back in the population (data base sample of NZGrapher).
The median length for female sharks is smaller at 116 cm and the median length for male sharks is 123 cm, a difference of 7cm. This indicates that the average male shark could be longer than the average female shark back in the population (data base sample of NZGrapher).
overlap shift spread and shape
Middle 50% (Interquartile range):
Overlap:
The middle 50% (IQR) for male shark lengths are between 104 cm and 139 cm , whereas the middle 50% (IQR) for female sharks lengths are between 101 cm and 132 cm. As can be seen from this data there is considerable overlap of the middle 50% (IQR's) for female and male sharks.
Shift:
The middle 50% (IQR) for the male sharks is shifted slightly to the right of the female middle 50%. The lower quartile for male shark lengths (104 cm) is higher than the lower quartile for the female shark lengths (101 cm) and the upper quartile for the male shark lengths (139 cm) is higher than the upper quartile for the female shark lengths (132)
Spread:
The IQR for male shark lengths is 35 cm whereas the IQR for female shark lengths is 31 cm. This indicates that there is more variation in the lengths of male sharks. Overall the dot plot distributions are quite similar, the female shark length range (max - min) is 192 cm and the male shark length range is 182 cm , a difference of 10 cm.
Shape:
Both female and male box plots and the female dot plot are approximately symmetrical. The bulk of the male shark dot plot (ignoring extreme values at either end) shows some left skewing of the data where male sharks measuring around 158 cm to 165 cm are lower in numbers than the female sharks of that length.
I think the distributions of lengths of female and male sharks would also have similar shapes back in the population of sharks in the NZGrapher database.
Making A Formal Inference
Bootstrapping For The Confidence Interval
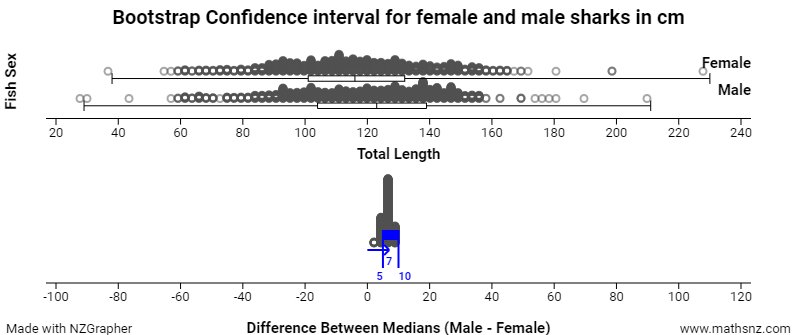
From the bootstrapping confidence interval I can be confident that the male shark length will be between 5 and 10 cm more than the length of the female shark from the sample population on NZGrapher.
conclusion
Based on looking at my sample I am reasonably confident that back in the population of all sharks in the population data base from NZGrapher that the median length of male sharks will be more than the median length of female sharks. I can make this call as the confidence interval tells us that the male median length is likely to be between 5 and 10 cm more than the median length of female sharks.
My bootstrap confidence interval for the difference between the median male sharks lengths and median female shark lengths indicates that a clear call can be made. That is, male sharks are longer on average than female sharks back in the population.
My bootstrap confidence interval for the difference between the median male sharks lengths and median female shark lengths indicates that a clear call can be made. That is, male sharks are longer on average than female sharks back in the population.
I am basing this conclusion on the bootstrap confidence interval I calculated, which involves re-sampling from my original sample of 2510 sharks whose lengths were recorded. The key assumption with this method is that my original sample was representative of the population of all NZ sharks. If I were to take another sample the results may have differed as that sample will contain a different make up of sharks.
