
ROLLING A SIX ON A DIE
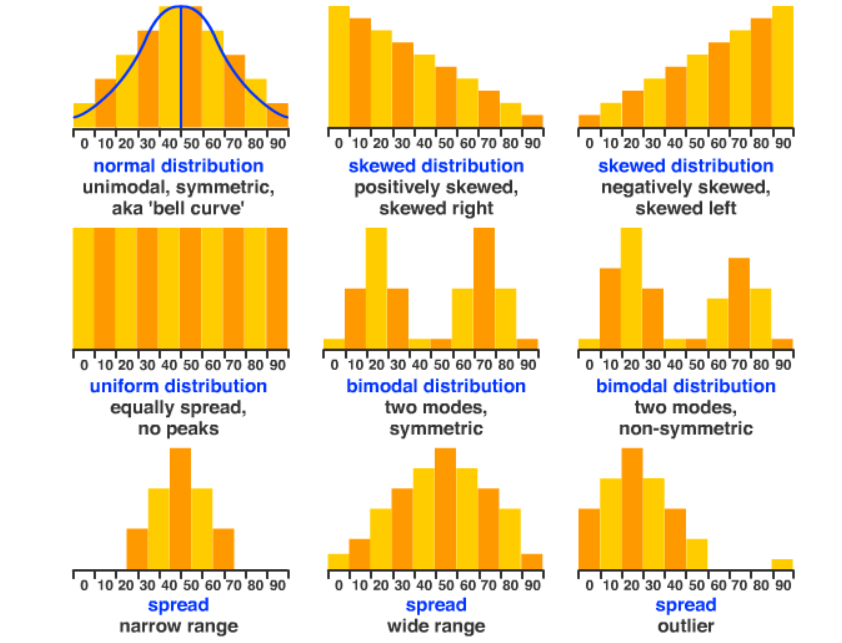
A range of different graph shapes you may encounter
PROBABILITY
Rolling a 6 on a fair sided die
Problem
I am interested in seeing how many 6’s I can get when I roll a fair 6 sided die 50 times.
From my understanding of probability I should expect to get a 6 once every 6 throws of the die. So 50 trials should give me about (50/6) or about 8 times.
Plan
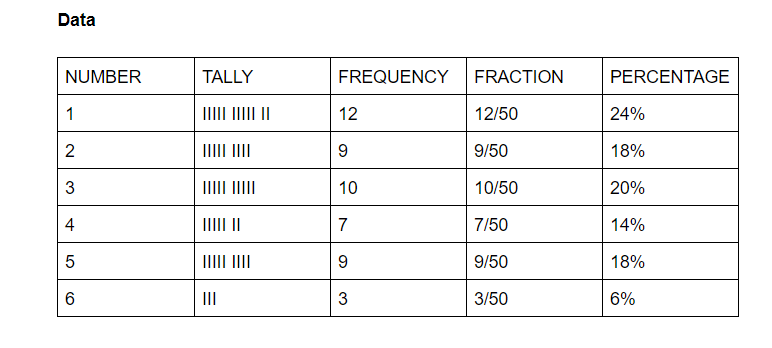
I will roll the die 50 times and record the number of 1,2,3,4,5 and 6’s I get. I will create a frequency chart and record the data there. I will then produce a bar chart based on the frequency.
Outcomes:
1,2,3,4,5, and 6 are possible outcomes
Rolling a 6 on a fair sided die
Problem
I am interested in seeing how many 6’s I can get when I roll a fair 6 sided die 50 times.
From my understanding of probability I should expect to get a 6 once every 6 throws of the die. So 50 trials should give me about (50/6) or about 8 times.
Plan
I will roll the die 50 times and record the number of 1,2,3,4,5 and 6’s I get. I will create a frequency chart and record the data there. I will then produce a bar chart based on the frequency.
Outcomes:
1,2,3,4,5, and 6 are possible outcomes
Analysis:
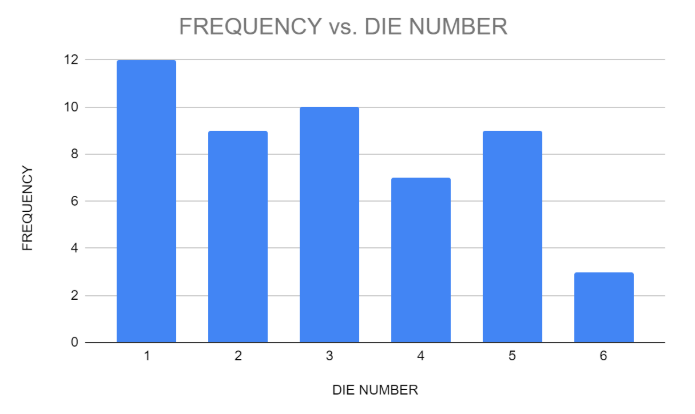
Looking at my graph I notice I got a 1 more often than the other numbers on my die (12 times out of 50). Getting a 6 came up the least amount of times (3 times out of 50).
Graph Shape (Distribution)
The shape of my graph is slightly skewed to the right because getting 1’s and 3’s came up more often. So the bars tend to get shorter from left to right.
Conclusion:
The number that came up the most was a 1 (12 times out of 50) or 24%. Getting a 6 didn’t happen very often just 3 times in the 50 trials. Theoretically, all numbers should have an equal chance of turning up on the die. However, I would expect similar (not exactly the same) results if I repeated the experiment another 50 times. Perhaps if I carried out the experiment hundreds or even thousands of times I might get a graph where all the bars are the same height.
