
sport science
(Australian institute of sport)
Grade Boundary: Low Excellence
1. For Excellence, the student needs to investigate bivariate measurement data, with
statistical insight. This involves integrating statistical and contextual knowledge throughout the
investigation process. It may include reflecting about the process, considering other
relevant variables, evaluating the adequacy of any models, or showing a deeper
understanding of the models.
This evidence is from a student’s response to the TKI task ‘Sport science’.
The student has posed an appropriate relationship question which is informed by
research (1), and has also described the nature and strength of the relationship and
related this to the context (2).
Contextual knowledge from the research (3) and statistical knowledge (4) have been
integrated into the discussion about the features in the data and in the evaluation of
the adequacy of the models (5). Other relevant variables have been considered in the re-categorisation into ball andno ball sports (6).
This extract is from a student response which also included evidence of using the
model to make a prediction and communicating findings in a conclusion, at an
appropriate level to be awarded Excellence.
For a more secure Excellence, the student could have reflected on the process more
deeply, for example by relating a visual inspection of the scatter graphs to the
adequacy of the models, and/or linking the findings to further research.
Bivariate Report on Sport Science.
Body image is a concern of modern women and just as much for female athletes as it is for
other ‘normal’ women. (http://thesportjournal.org/article/body-image-disturbances-ncaadivision-
i-and-iii-female-athletes). Weight charts can be unreliable as a source for determining the healthy weight for athletes and body fat percentages are sometimes used instead. Women tend to weigh in the top range for their heights due to muscle mass being heavier than fat mass.
During the 2012 London Olympics the media reportedly criticised some female athletes
suggesting that they were fat rather than fit. A list of top female athletes hit back at critics in
an article ‘Fat? We are fit. Get over it’ by Belinda Goldsmith.
(http://sports.yahoo.com/news/fat-fit-over-women-athletes-193539328--spt.html)
I am going to investigate if there is a relationship between the weight of a female athlete and
their percentage of body fat. I have taken the percentage of body fat as the explanatory
variable and the weight as the response variable.
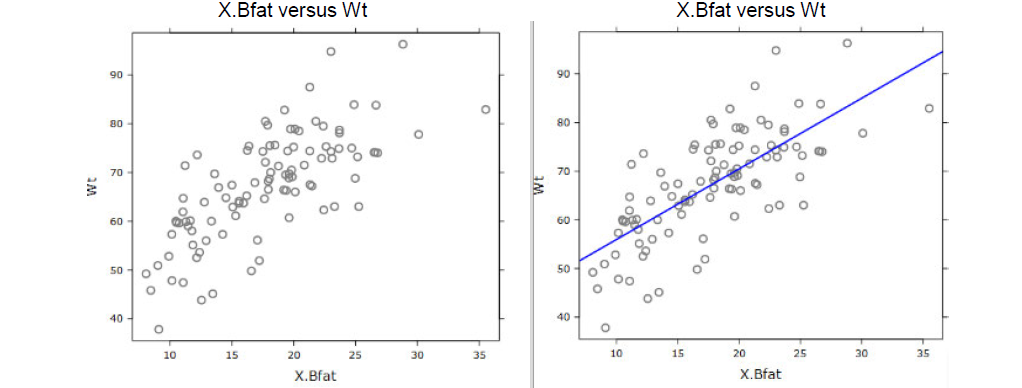
The first scatter graph shows us that there is a positive relationship between the weight of
female athletes and their body fat percentage, i.e. people with a higher percentage of body
fat tend to be heavier. This is consistent with what we would expect. It also appears to have
a linear relationship and there is nothing to suggest that a different model would be better fit
to the data. The strength of the relationship is quite strong, as shown by the data points not
too far away from the line of best fit in the second graph.
The American Council on Exercise (ACE) divides body fat percentage into five different
categories: essential, athletes, fitness, acceptable and obese. Essential body fat ranges from
10 to 14%, athletes 14 to 20% and fitness 21 to 24%. The acceptable range of body fat for
women is 25 – 31% and a woman with a body fat percentage of over 32% is considered
obese. The percentage of body fat in my scatter graph is mostly between 10 and 26% so this
sort of fits what the ACE are saying. There is not much data with a percentage of body fat
over 30% but I don’t think this means that those in this range won’t be athletes more that
most athletes in most sports will be under this. There is one value of 35% body fat and
looking at the original data this value is for a Netballer. I have looked at the other athletes in
the data from the Australian Institute of Sport that have a body fat percentage of more than
25% and 7 of them are netballers and there is one basketball player – this suggests that
maybe netballers will be in the higher range of percentage body fat.
Linear model
We see by the trend line that this is indeed a positive relationship - as the percentage of body
fat of female athletes increases their weight in kg tends to increase. The gradient of the trend
line, Wt= 1.451*%.BFat+41.443, shows us that for every 5% that your body fat increases you
can expect to add approximately 8kg to your total weight. The scatter in the graph is
consistent across the data set, and most of the data points are close to the regression line
indicating that the relationship between percentage body fat and weight of females athletes is
strong.
