
TRIG WHEEL 10 TOM AND JERRY
Tom and Jerry are going to go on two different Ferris wheels. One wheel is smaller than the other. Jerry accesses the smaller wheel by a ramp which is 2 m off the ground. The wheel reaches a maximum height of 15 m. Tom accesses a larger Ferris wheel by a ramp that is 4.5 m above ground and reaches a maximum height of 28 m above ground. The two wheels are separated by the the ghost ship ride. When in range Tom is capable of springing onto Jerry’s wheel by jumping across the ghost ship. At other times on the ride he cannot. Both rides last 2 minutes and start at the same time.
They both got on their Ferris wheels at the lowest point and at the same time. Jerry’s Ferris wheel is going around 2 revolutions/minute and Tom’s, 3 revolutions in 2 minutes. Sketch a diagram showing the wave forms for both graphs verified with your calculator. Find the times at which Jerry is within range of Tom. Tom can catch Jerry if he is ascending (rising) and is more than 7 m off the ground but less than 18 m off the ground.
amplitude (A)
Jerry: A =(max - min)/2 = (15 - 2)/2 = 6.5 m.
Tom: A = (max - min)/2 = (28 - 4.5)/2 = 11.75 m
Tom: A = (max - min)/2 = (28 - 4.5)/2 = 11.75 m
frequency (B)
The frequency B is equal to the distance of 2π divided by the time for one period.
Jerry's wheel , is: 2π/30 = π/15 so B = π/15
Tom's wheel : is 2π/40 = π/20 so B = π/20
Jerry's wheel , is: 2π/30 = π/15 so B = π/15
Tom's wheel : is 2π/40 = π/20 so B = π/20
horizontal shift (C)
The negative cosine wave that we have been sketching to describe the motion of the wheel is the same as a sine wave that has been translated to the right on the x axis. It has moved by 1/4 or π/2.
For Jerry, this means that distance along the x axis happens to be 1/4 x one period = 1/4 x 30 = 7.5 seconds. So the value of C = 7.5 and is written as (t - 7.5)
For Tom, this means that distance along the x axis happens to be 1/4 x one period = 1/4 x 40 = 10 seconds. So the value of C = 10 and is written as (t - 10)
vertical shift (D)
Both Ferris wheels are at different heights,
Jerry's wheel = (max + min )/2 = (15 + 2)/2 = 8.5 m above the ground, so D = 8.5
Tom's wheel = (max + min )/2 = (28 + 4.5)/2 = 16.25 m above the ground, so D = 16.25
Jerry's wheel = (max + min )/2 = (15 + 2)/2 = 8.5 m above the ground, so D = 8.5
Tom's wheel = (max + min )/2 = (28 + 4.5)/2 = 16.25 m above the ground, so D = 16.25
final equation
Jerry: h(t) = 6.5 sin (π/15(t - 7.5)) + 8.5
Tom: h(t) = 11.75 sin (π/20(t - 10)) + 16.25
Tom: h(t) = 11.75 sin (π/20(t - 10)) + 16.25
on the calculator
You can enter the two equations to get a feel for the graphs. This time however, we are not concerned with where the graphs intersect but the 'window of opportunity' that exists such that Tom the cat can catch Jerry the mouse. The rules are that Tom has to be ascending or rising. Jerry can be going up or down. The window of opportunity is between the height values of 7 m and 18 m. Above or below these values doesn't count. So you can ignore everything above the 18 m line and below the 7 m line.
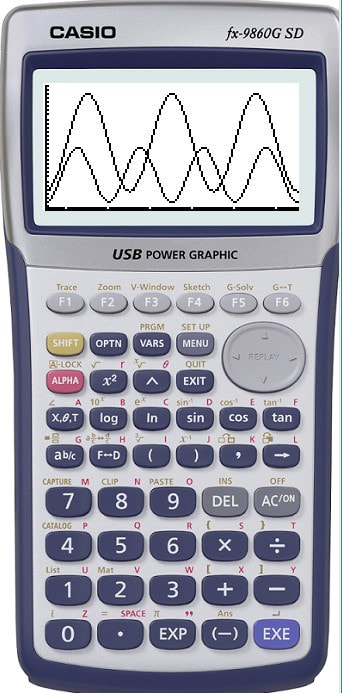
Fig.1
|
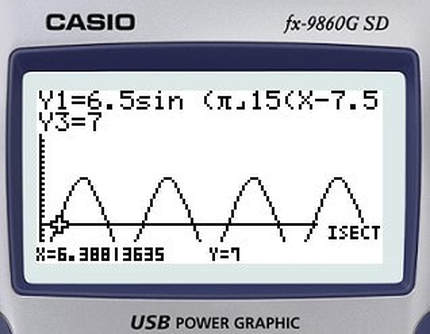
Fig.2 Jerry the mouse
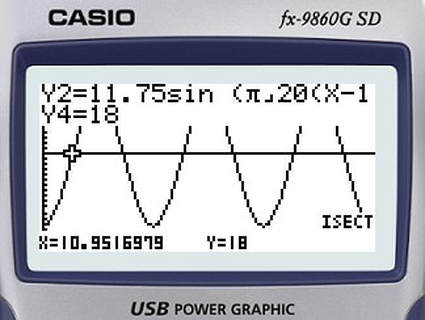
Fig.3 Tom the cat
|
Fig.1 above shows both graphs together.
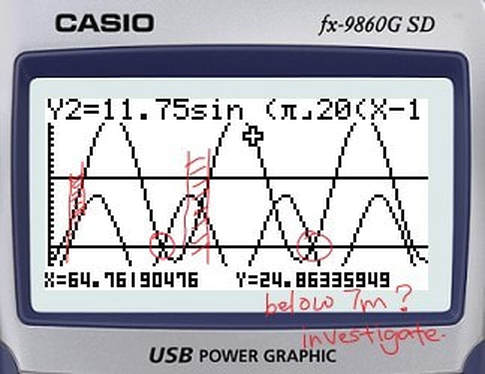 Fig.4 the combined graphs
Fig.2 shows the first point of the window of opportunity at 6.4 seconds and ends at 10.95 seconds where Tom rises above 18 m. This is also shown by the shaded red section of Fig.4 above.
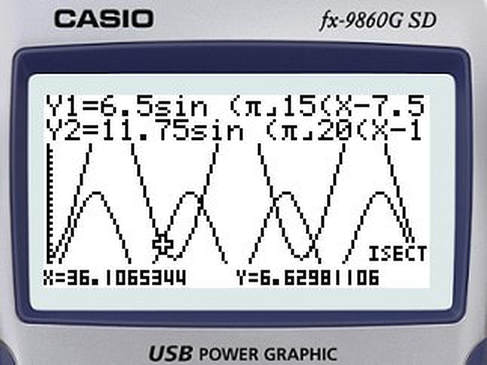
Fig.5
The next point you could investigate is where the two graphs cross at which looks like could be around 7 m. However, referring to Fig.5 above GSLV ISCT shows these points are at 6.63 m (below the window of opportunity).
The next area to look at is where Tom the cat is ascending for the second time, see Fig.6 below.
The next area to look at is where Tom the cat is ascending for the second time, see Fig.6 below.
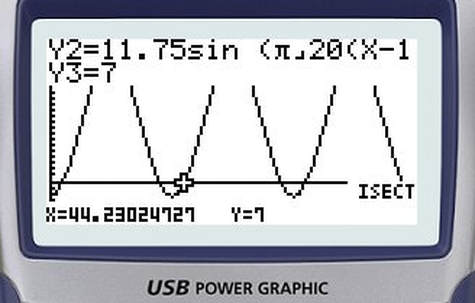
Fig.6
At this point, Jerry the mouse is above Tom and in range. This starts at 44.23 seconds and lasts until Tom reaches 18 m and Jerry is then out of range. This is at 50.95 seconds see Fig.7 below.
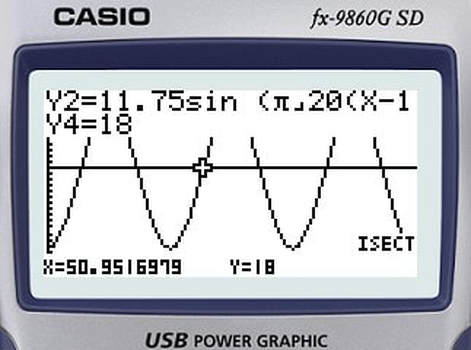
Fig.7
summing all the intervals together
The total time that Jerry is in range of Tom is found by adding all the intervals together (there were two of them).
1) Between 6.4 seconds and 10.95 seconds after the ride began = Total of 4.55 seconds
2) Between 44.23 seconds and 50.95 seconds after the ride began = Total of 6.72 seconds.
This means there was 4.55 + 6.72 = 11.27 seconds where Tom was able to catch Jerry the mouse. This pattern would repeat again for the next two minutes and so on.
A sketch approach to the solution
Sketch each waveform separately. For the small wheel, identify each section where the wheel is above the 7 m line, (a- b), (c - d) etc. Annotate on each the intersecting points with the two limits (i.e. lower and upper heights of 7 m and 18 m) See below.
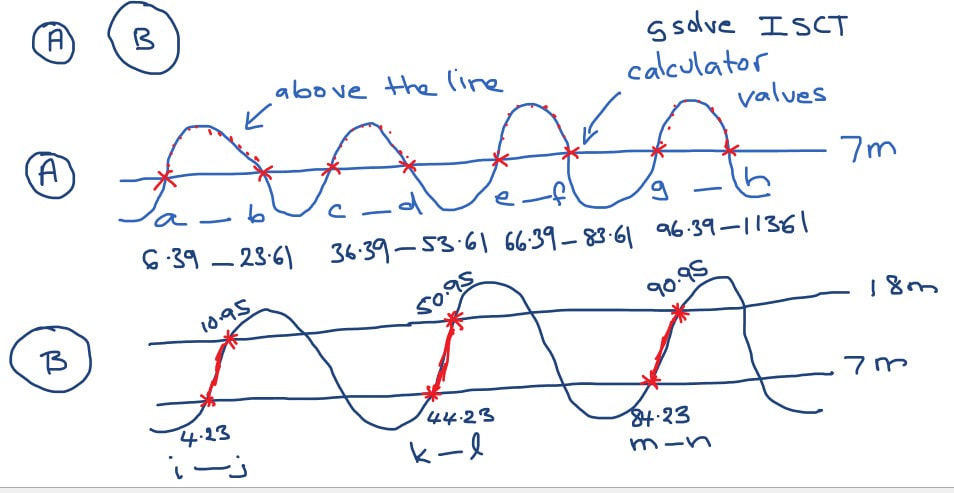
Now sketch a number line making sure your paper is large enough to capture all the information.
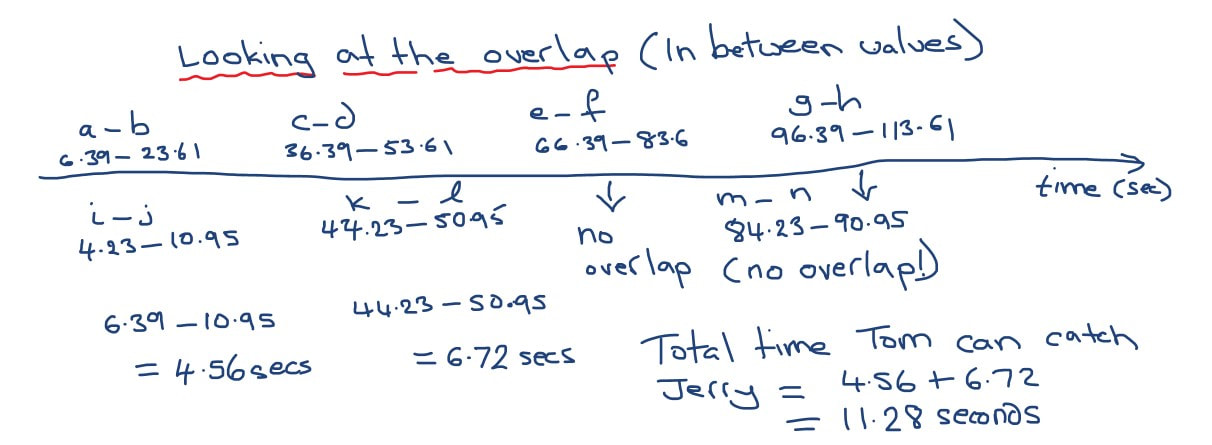
Tom can catch Jerry between 6.39 to 10.95 and between 44.23 to 50.95 seconds, a total of 11.28 seconds.
