graphing calculator
It takes many weeks of training to learn how to use the graphics calculator and the methods demonstrated here are not the only ones. We only have time for some basic familiarisation.
Part A:
Use table mode to draw the following graphs. Four graphs are positive (upright or happy) and two graphs are negative (upside down or sad). You will need to learn when to click the EXE key (it is like the = key on normal calculators and follows most actions. Use the EXIT button when you get lost to take you back to a previous menu. Refer to the screenshots if you get stuck.
You can delete a graph once you have graphed it but you can store all six graphs and simply 'select' the one you want to draw. The calculator cannot solve graphs if two or more are drawn on the screen.

Part B:
Use Graphing mode to locate and label the coordinates of the vertices (minimum and maximum points), the y axis and x axis crossing points.
Use Graphing mode to locate and label the coordinates of the vertices (minimum and maximum points), the y axis and x axis crossing points.
example
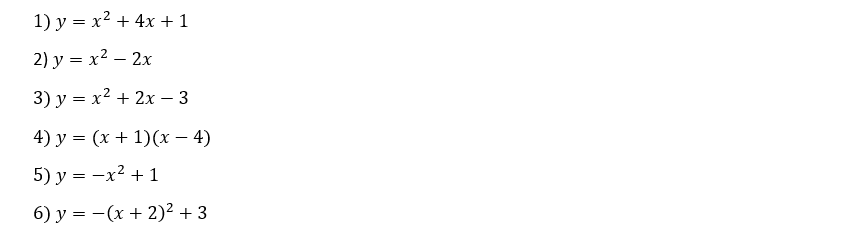
Use table mode to draw the following graph:

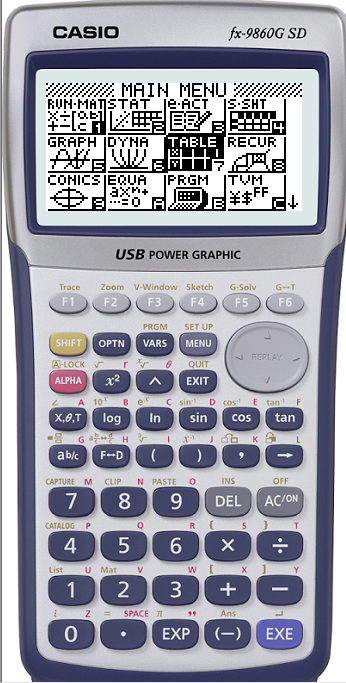
Select Table mode from the menu
|

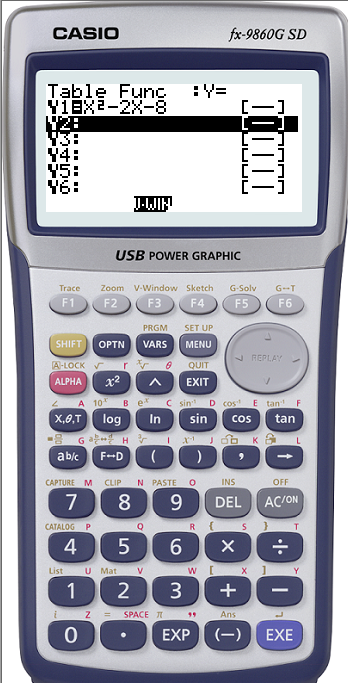
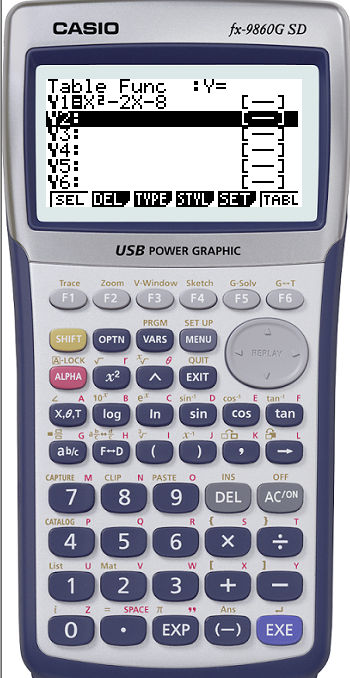
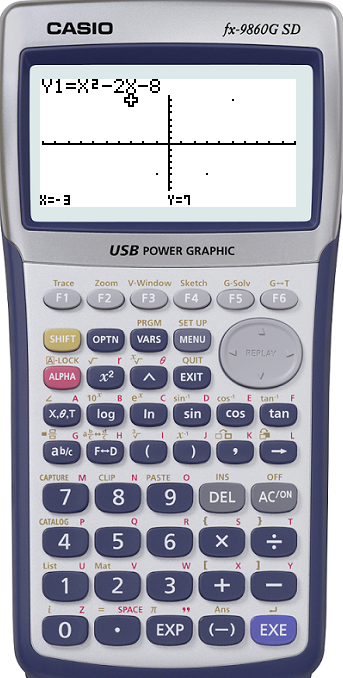
Enter the equation
|
Select View Window
|
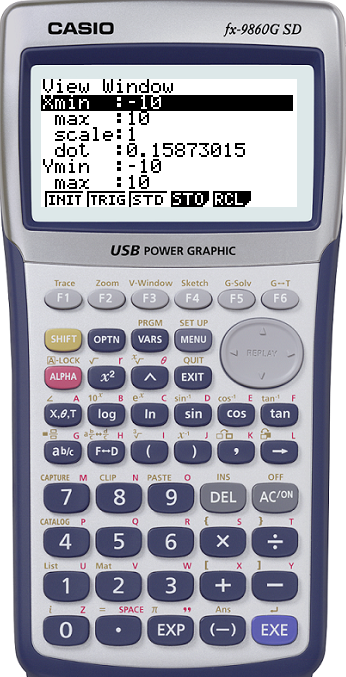
Select STD for a -10 to +10 cartesian plane (axis)
|
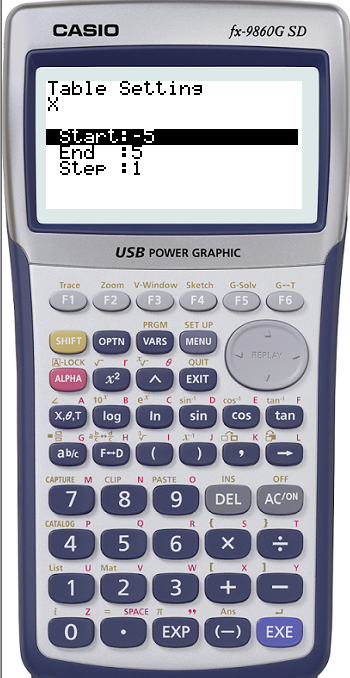
Select SET for Start = -5 and End = 5
|
Select TABLE
|
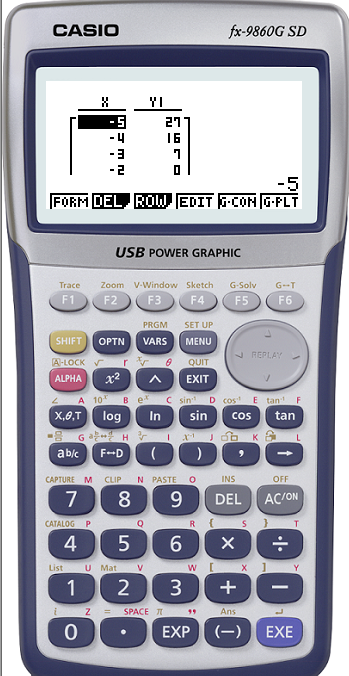
Select G-PLT (Gplot) or G-CON (Gconnect)
If the graph doesn't fit the screen you may have to adjust View Window again
|
Select Shift Trace to locate points around the curve using the cursor key pad and copy onto your graph paper
|
or you could use Gconnect to get a better or easier picture of what the graph looks like
|
Use graphing mode to locate important information about the graph like x and y crossing points and minimum and maximum points. Use the same functions as above.
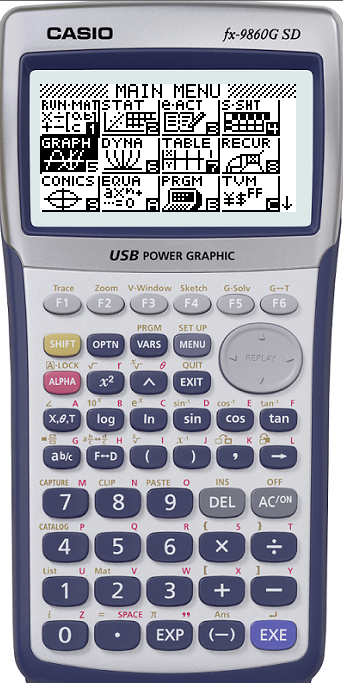
Select graphing mode from the main menu
|
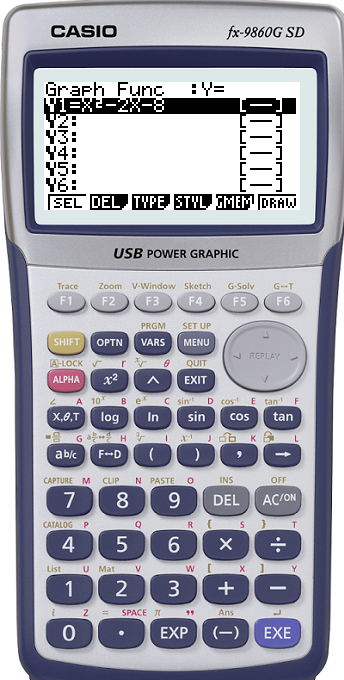
Enter in the function and choose view window with STD for a -10 to 10 graph. Selwct draw
|
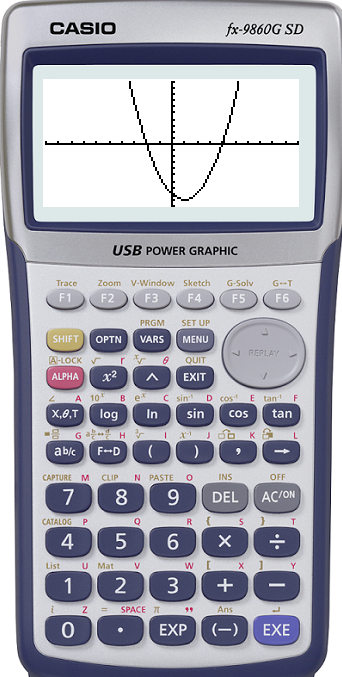
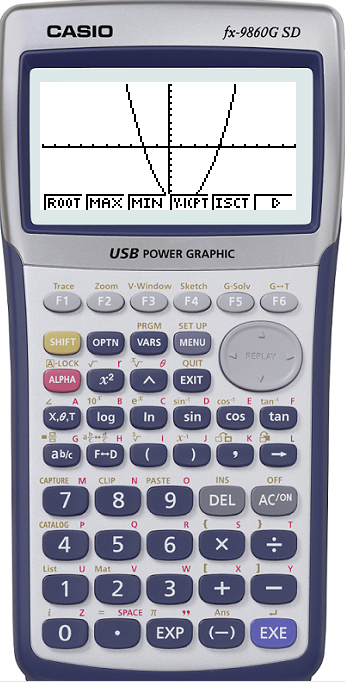
The graph should look similar to this
|
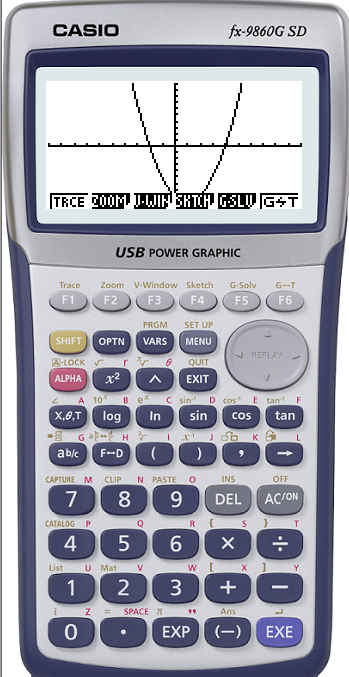
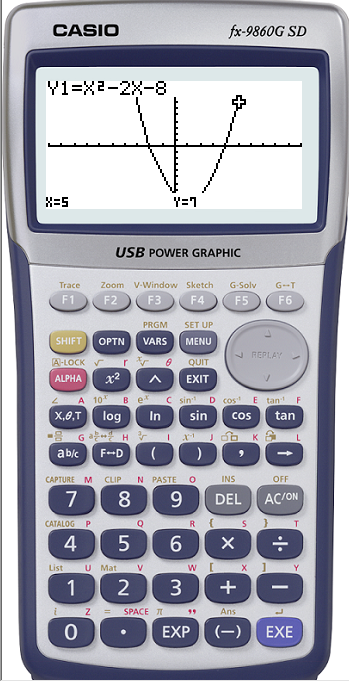
Click Gsolve
|
Select MIN
|
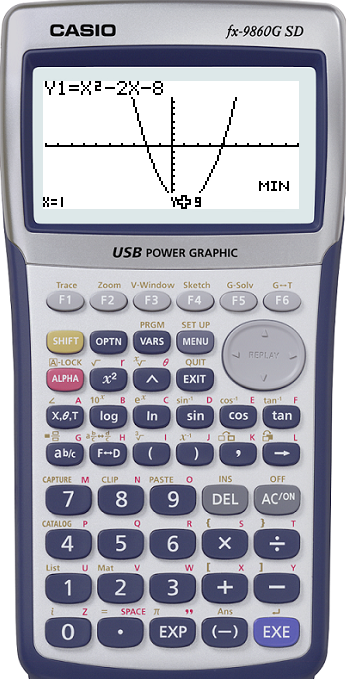
Minimum point is shown by curser, x and y values are displayed
|
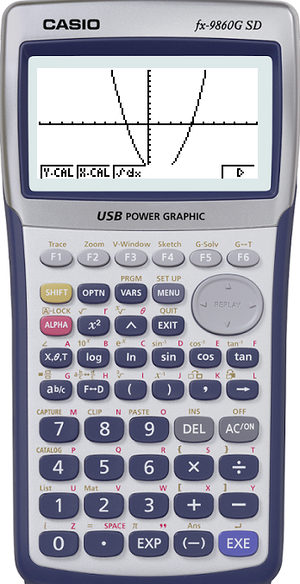
Arrive at this screen by selecting Gsolve, click the little arrow on the right.
|
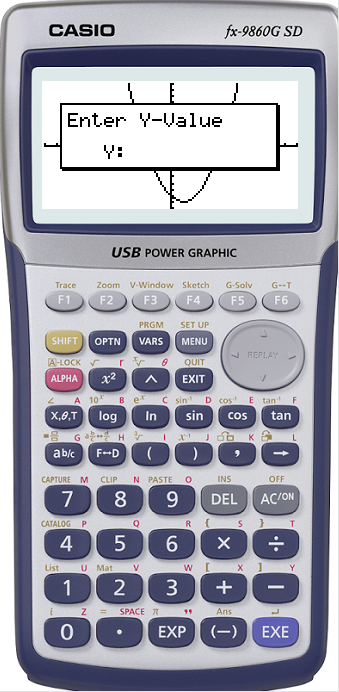
Enter 0 for the y value
|
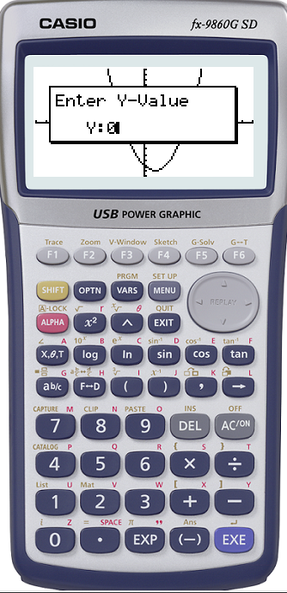
click the EXE key to action.
|
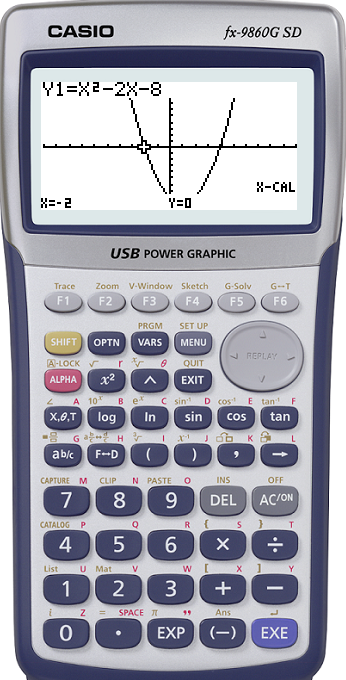
|
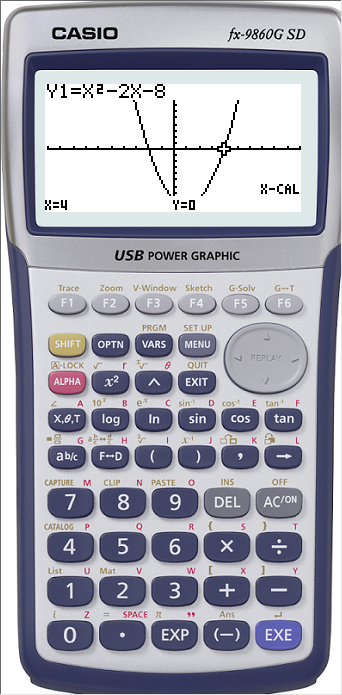
Use the cursor key to toggle between the two x values (that is, if there are two values as sometimes there is only one value and sometimes no values because the graph doesn't cross the x axis. But all our examples do so that's ok
|
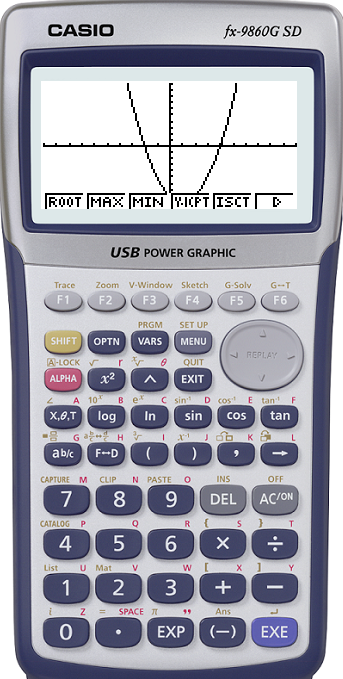
Go back to GSolve and select Y-ICPT (y intercept) the following screen shot shows the result.
|
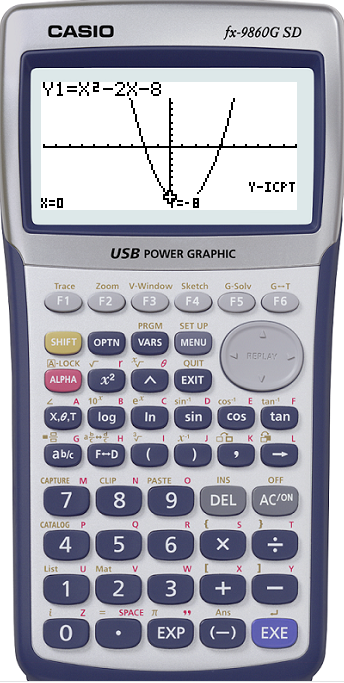
These are the essentials for graphing functions like parabolas. The calculator is much more powerful than this and it takes many weeks to really become familiar with its use. Ideally you would use both the calculator and drawing methods from a table. You have to decide if the investment is worth it. Your teachers in the following years will advise you on what to do. Most teachers have class sets. However, there are never enough for everyone.
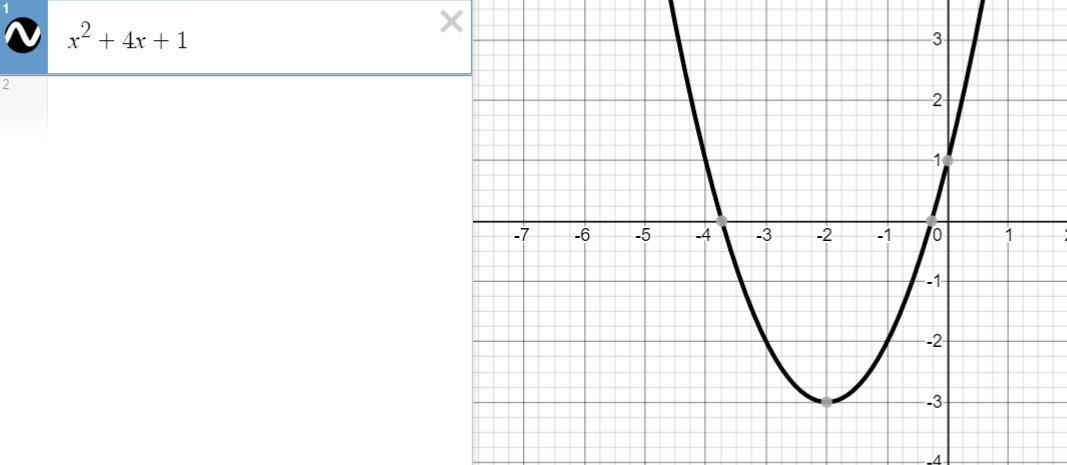
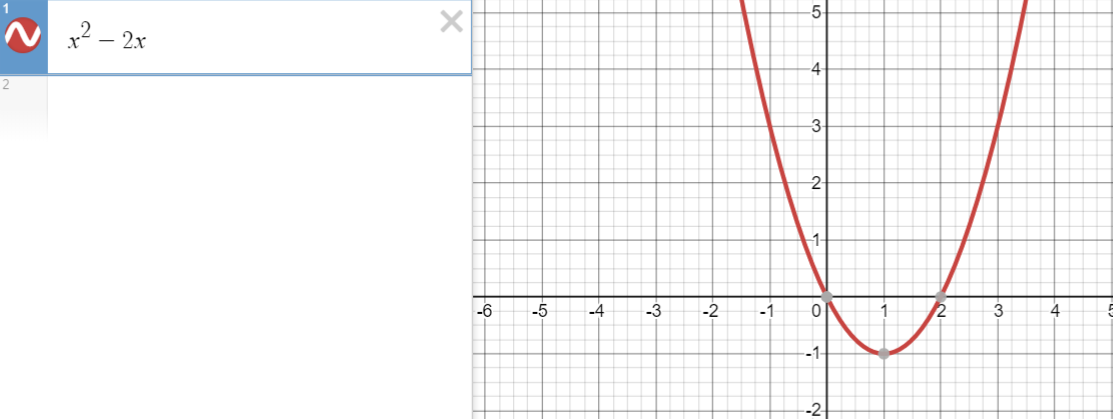
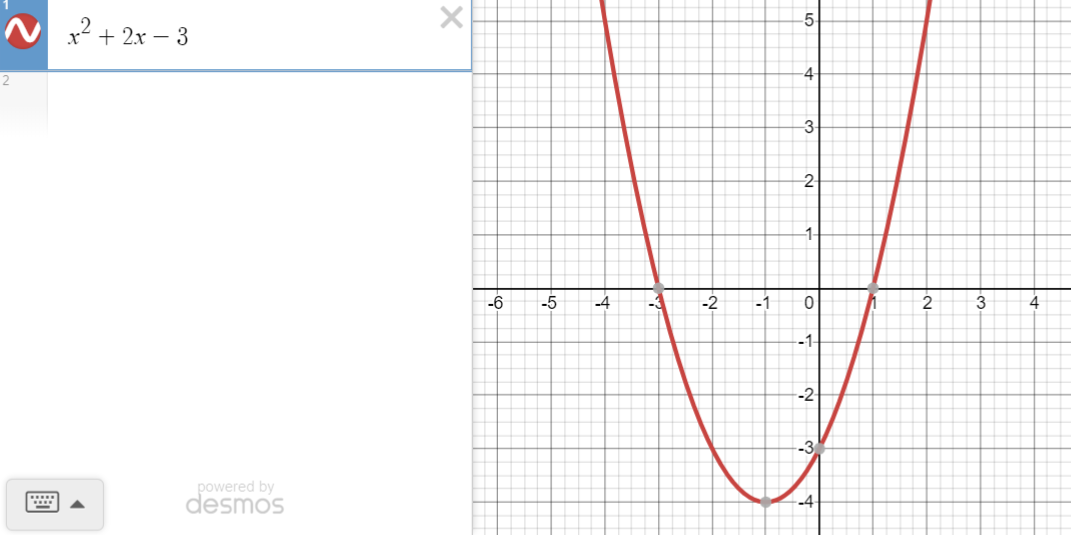
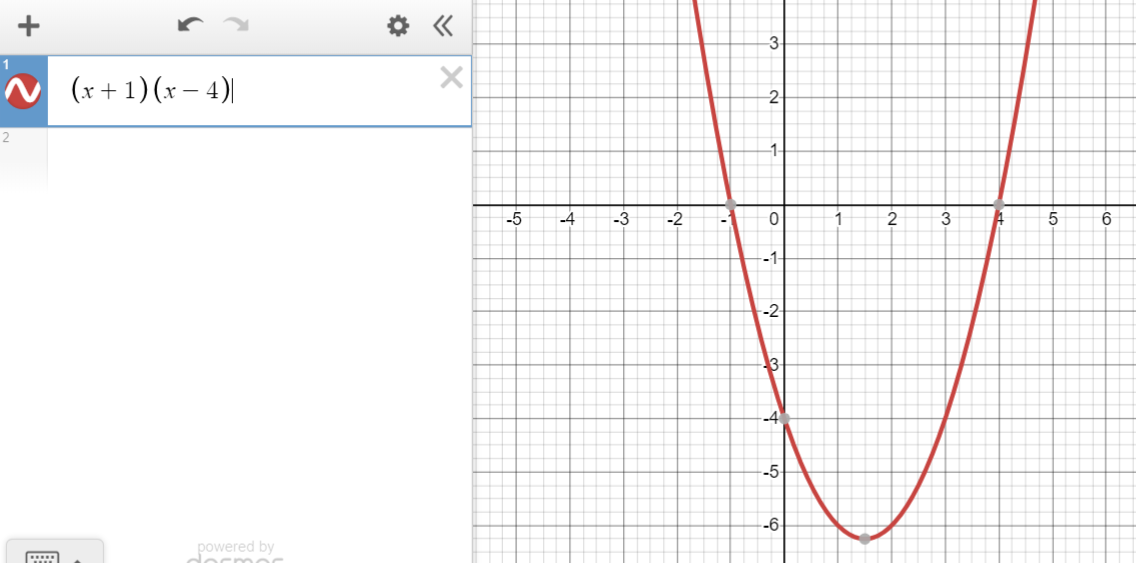
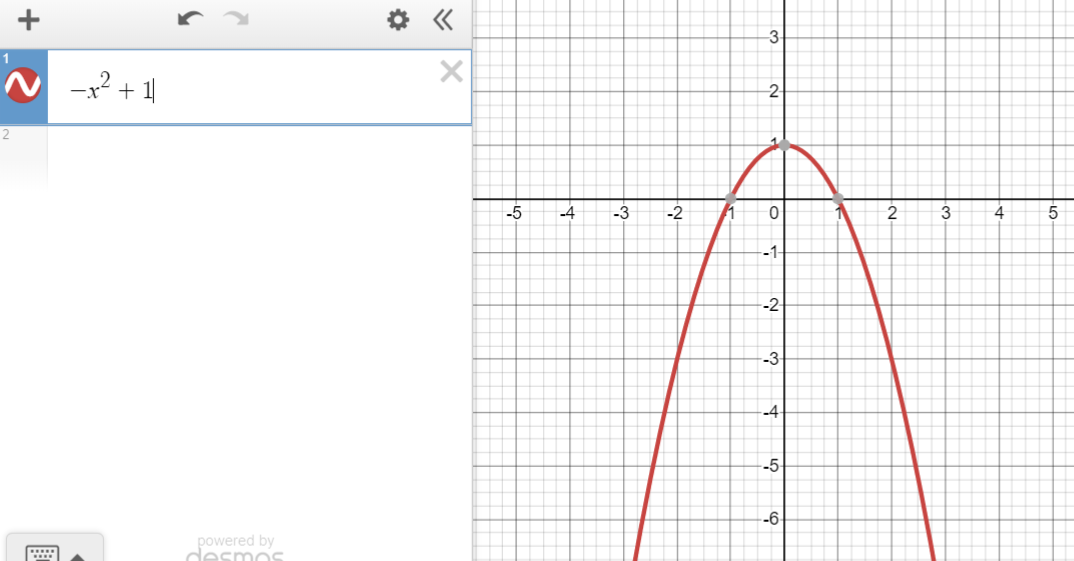
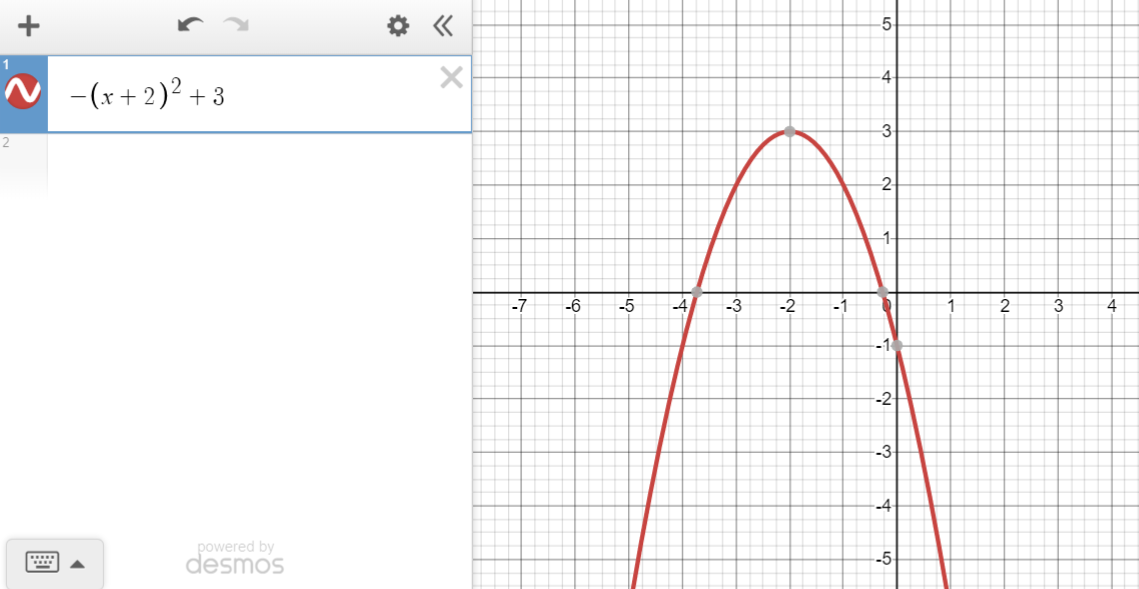
answers for the first section
(most of the answers for the second section can be read off the graphs)