
Review from Level 1
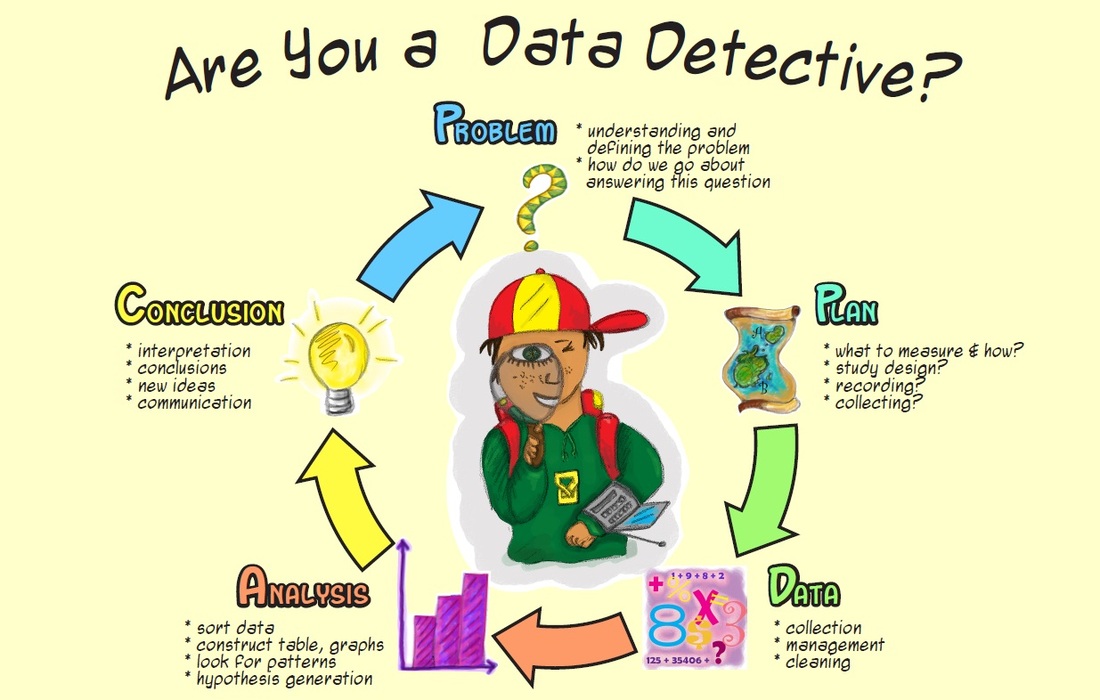
In Level 1 statistics you carried out an investigation and wrote a report based on the statistical enquiry cycle or PPDAC. The diagram below explains what the individual terms mean.
In Level 1 statistics you carried out an investigation and wrote a report based on the statistical enquiry cycle or PPDAC. The diagram below explains what the individual terms mean.
You were given a set of sampled data that was taken from a much larger data base, the NZ census at school data base which contains thousands of data records about New Zealand students. Some of the data included variables such as student height, weight and arm span etc. for both male and female students in Year 11. Below is an abbreviated example which is not intended to be a complete solution to this investigation, but which will cover the main points.
PROBLEM
Choose a variable and compare the two groups. Began with an investigative question. For example 'I wonder if the median height of year 11 boys is greater than the median height of year 11 girls in the NZ census at school database?' I think that boys might be taller because I can see this from observations within my own class'.
PLAN
The plan of action describes what variable you are measuring and how you collect relevant statistics. "I'm going to collect the data from the NZCensus database provided and calculate the 5 number summaries for each gender. I will then draw a box and dot plot to show my data. I will describe features of the graphs, commenting on the distribution of the data and draw a conclusion so as to answer my investigative question".
DATA
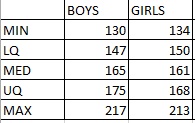
I have collected my data and produced a table of summary statistics (5 number summaries) for each gender etc. The summary statistics were:
minimum - the smallest value
lower quartile - middle of the lower half of the data
median - the middle or central value
upper quartile - the middle of the upper half of the data
maximum - the largest value
An appreciation of the mean value was also expected. The values of my sample are shown below. The values are in the same order as the 5 number summary so so that Excel 2013 will convert the data into box plots. (iNZight and NZ grapher will likely be the apps used in 2016).
PROBLEM
Choose a variable and compare the two groups. Began with an investigative question. For example 'I wonder if the median height of year 11 boys is greater than the median height of year 11 girls in the NZ census at school database?' I think that boys might be taller because I can see this from observations within my own class'.
PLAN
The plan of action describes what variable you are measuring and how you collect relevant statistics. "I'm going to collect the data from the NZCensus database provided and calculate the 5 number summaries for each gender. I will then draw a box and dot plot to show my data. I will describe features of the graphs, commenting on the distribution of the data and draw a conclusion so as to answer my investigative question".
DATA
I have collected my data and produced a table of summary statistics (5 number summaries) for each gender etc. The summary statistics were:
minimum - the smallest value
lower quartile - middle of the lower half of the data
median - the middle or central value
upper quartile - the middle of the upper half of the data
maximum - the largest value
An appreciation of the mean value was also expected. The values of my sample are shown below. The values are in the same order as the 5 number summary so so that Excel 2013 will convert the data into box plots. (iNZight and NZ grapher will likely be the apps used in 2016).
ANALYSIS
The next step was to compare summary statistics (5 number summaries) and features of the graphs between the two genders. You didn't have to explain all of the features to Achieve but the main features were:
median or centre
spread or distribution or variation
shape like symmetry and skewing
shift
overlap
unusual features
(Box plots or box and whisker graphs show as vertical or horizontal boxes when done in Excel.They can also be drawn with the graphics calculator or using the iNZite utility in the computing pod. NZ grapher is an excellent application that is also easy to use).
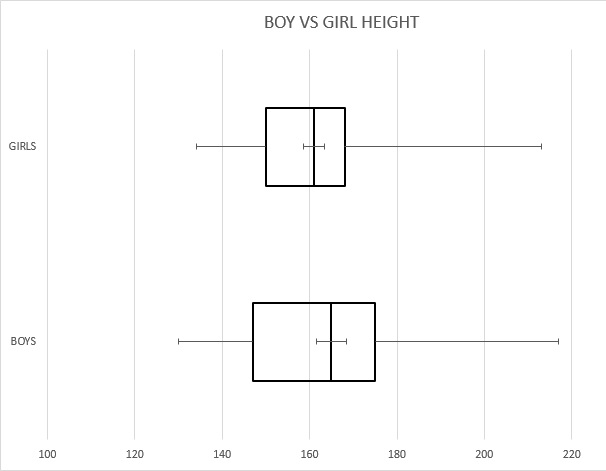
The boys median height is 165cm, higher than the female median of 161cm. The spread or middle 50% (also known as the interquartile range, the box bit) is wider for the boys data than the girls. I notice the boys and girls boxplots are slightly skewed to the right (whiskers trailing to the right). There is no noticeable shift in the boxplots, the boys box completely overlapping the girls box. There are a couple of really small height measurements for boys and girls (130cm and 134cm) and some really tall ones.(217cm and 213cm) which makes me wonder if they are possible outliers for year 11 students. I would investigate these unusual values further. At this level we would use the 1/3 rule to make any claim in answering the question, but you have to explain how the rule works
CONCLUSION
Looking at my graph I can't make the call that boys are taller than girls in my sample from the NZCensus database (the population). This is because the distance between the two medians is less than 1/3 of the overall visible spread. This surprises me as it doesn't fit my expectations. I suspect that if another sample was taken I might get slightly different results indicating that boys might be taller in the NZCensus at school database.
