
graphing
Showing the capabilities of DESMOS in graph drawing
oasis exercise
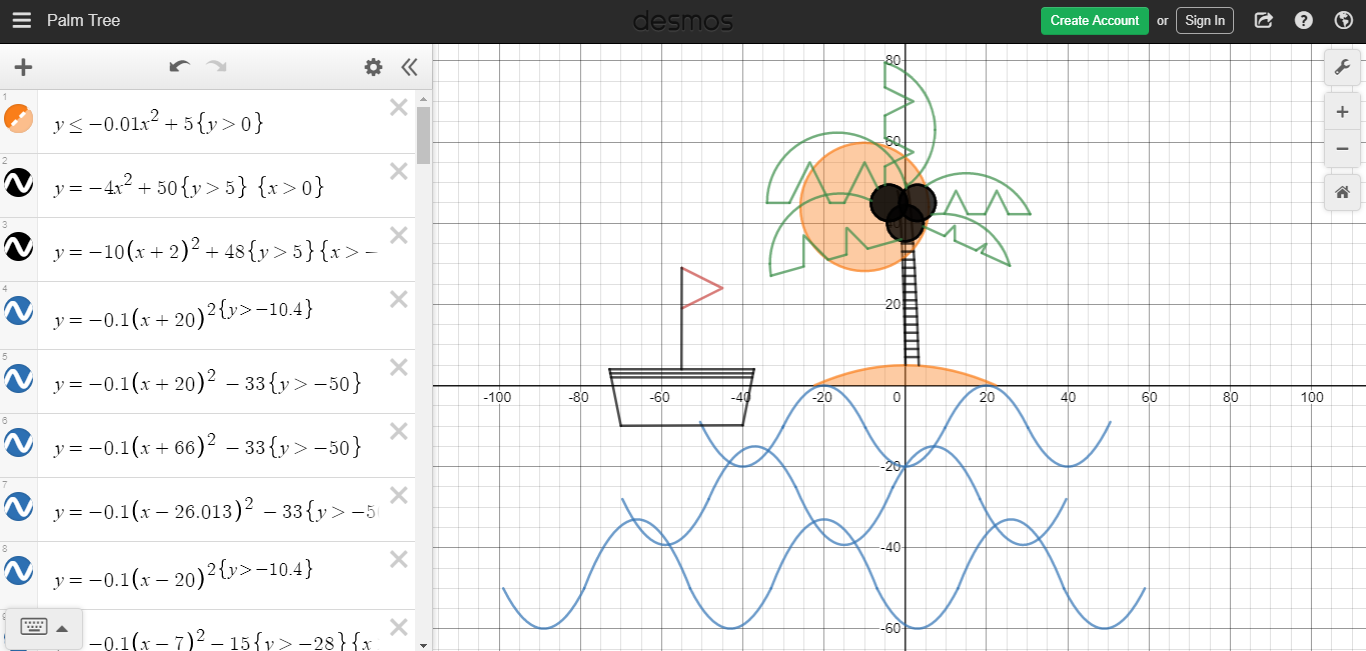
The aim of the exercise is to write equations for the curves that make up the image of a desert scene. Make sure you match your equations with the correct graphs. Labeling each graph should help. In this example 5 different graphs have been identified. This exercise is quite condensed and backs up the classroom learning.
To achieve, you must give at least two equations and domains for the image or a new design. The equations must be non-linear and different function types. For example, graphs 1, 2 and 3 are not different function types. You will not be penalised for minor errors in the domains.
To achieve, you must give at least two equations and domains for the image or a new design. The equations must be non-linear and different function types. For example, graphs 1, 2 and 3 are not different function types. You will not be penalised for minor errors in the domains.
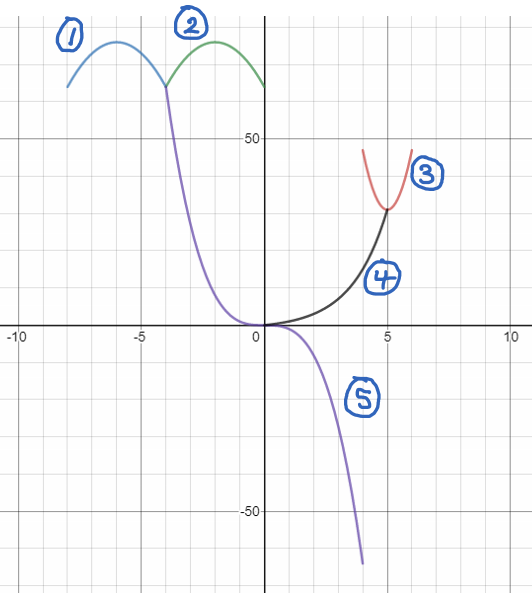
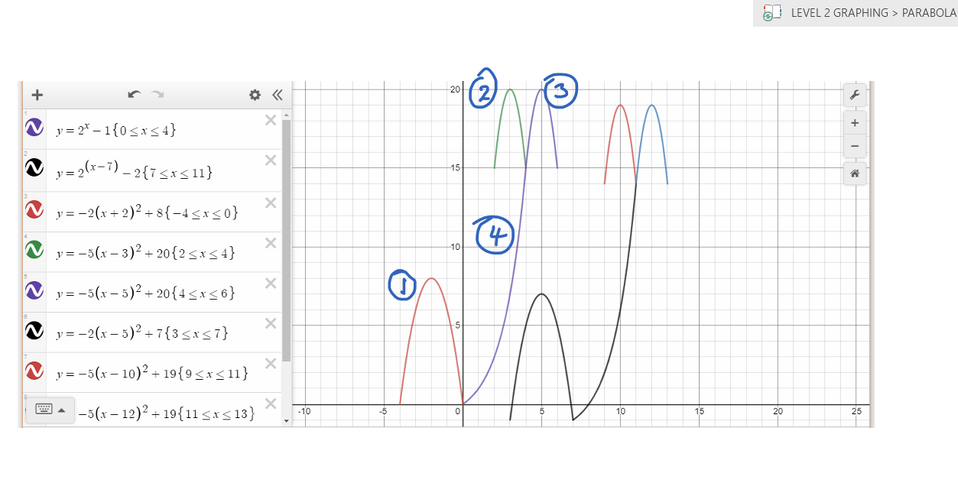
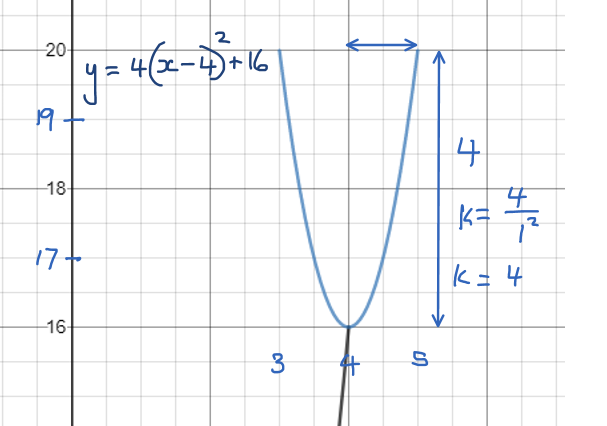
Let's zoom in further to investigate the graphs, starting with graph1 and graph2. Because they are upside down parabolas the values for k will be negative. The method used here is called rise over run squared. Notice how two different triangles formed for rise over run squared give the same value for k of 3.
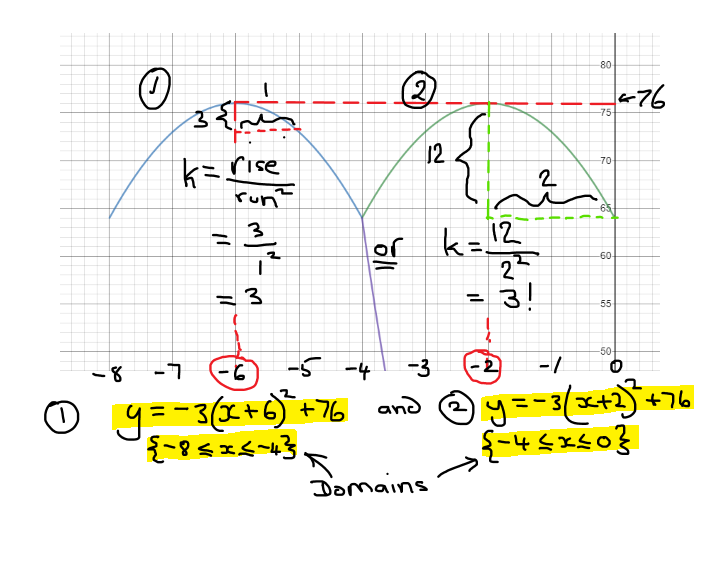
Notice the graphs are both shifted in the vertical by 76 units and shifted horizontally from the standard position at the origin by 6 and 2 units respectively.
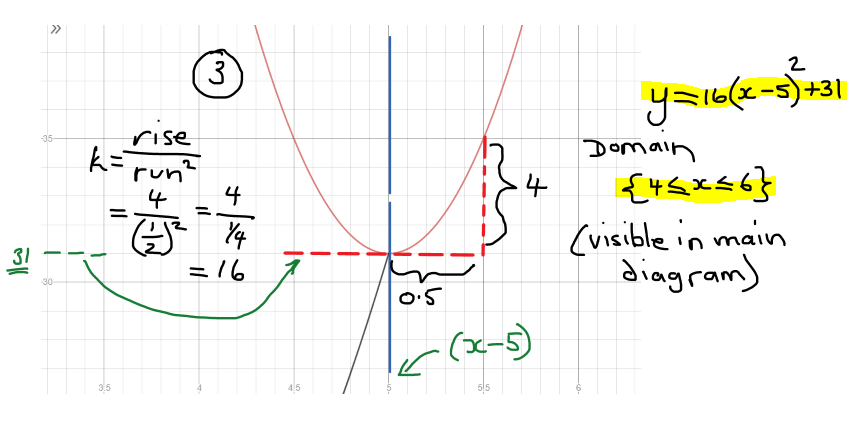
Now the equation for graph number 3. Identify and mark out important points for forming the equation. Notice the x axis is in units of 0.5!
Now the equation for graph number 3. Identify and mark out important points for forming the equation. Notice the x axis is in units of 0.5!
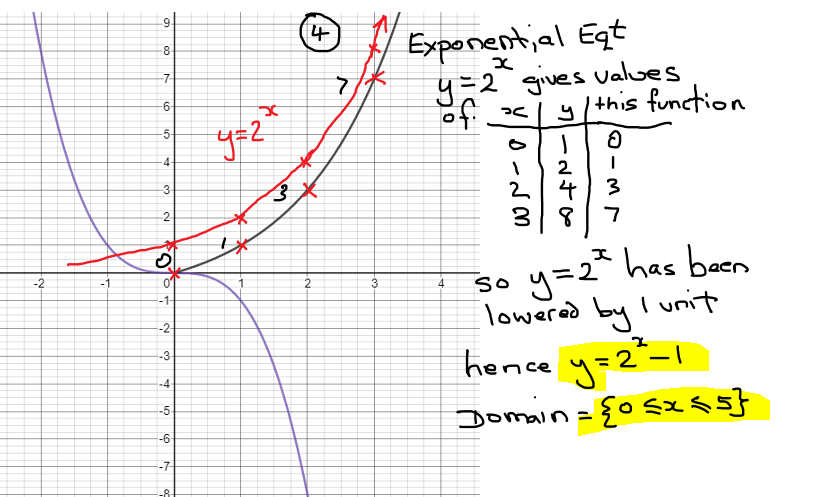
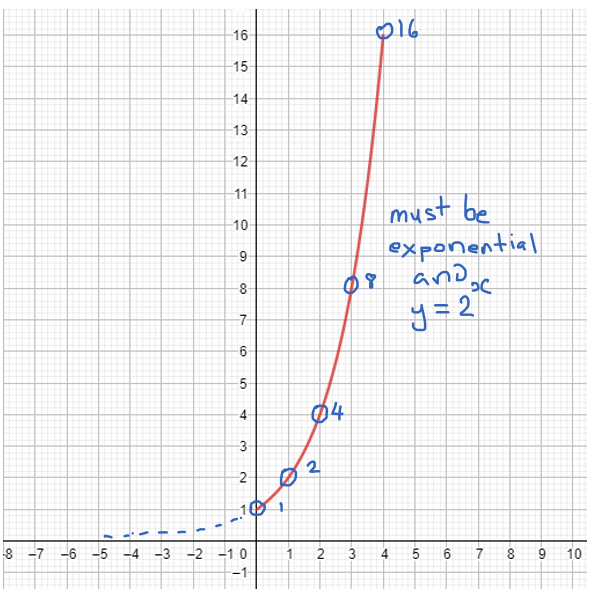
Equation for graph 4. Once again, locate and identify the points at whole number locations. Look for a pattern in the y axis numbers and compare with what you have learnt. You should recognize that it is an exponential.
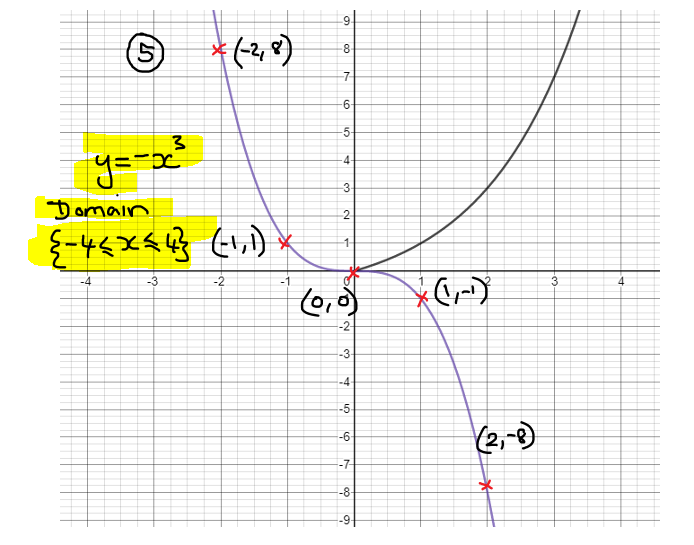
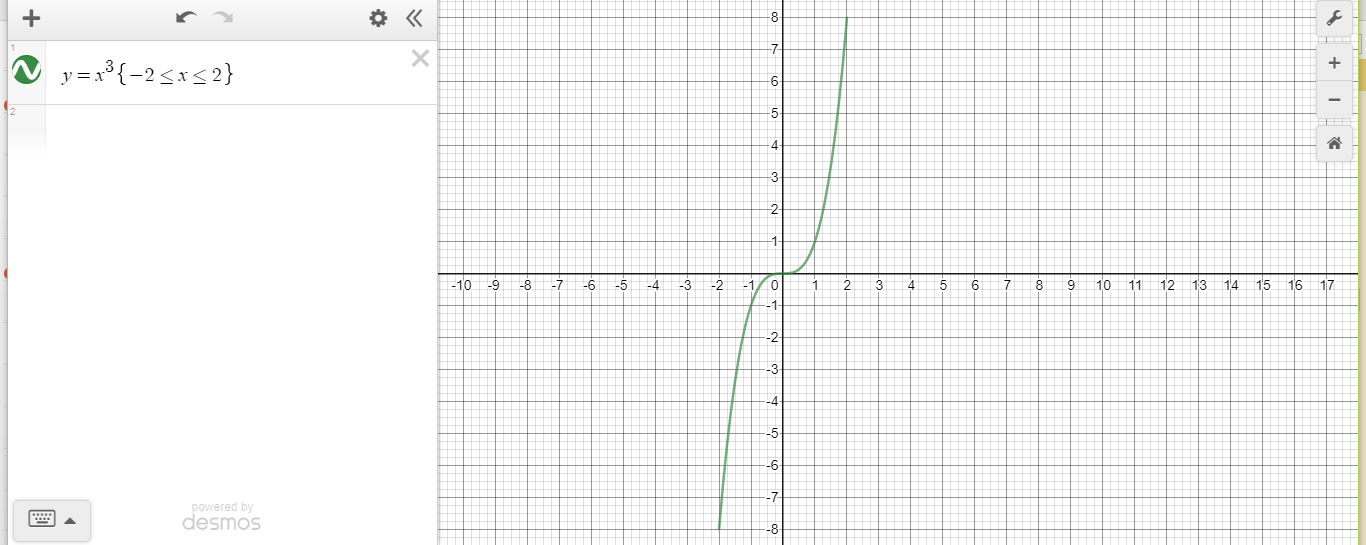
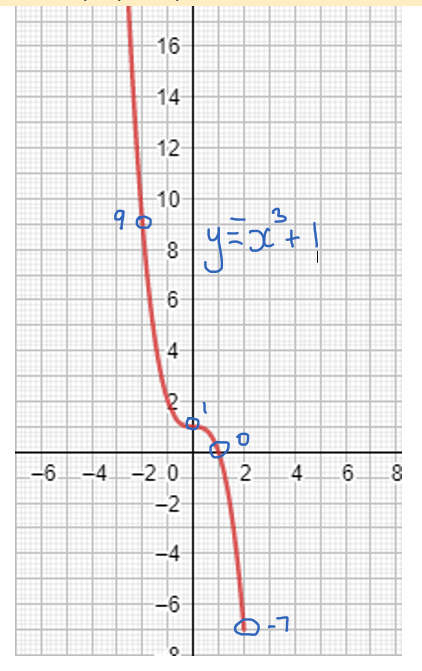
Finally you should recognize that graph 5 is a cubic function with a power of 3. Again identifying some of the points will help. The domain goes from negative 4 to plus 4 from the main graph at the beginning.
merit
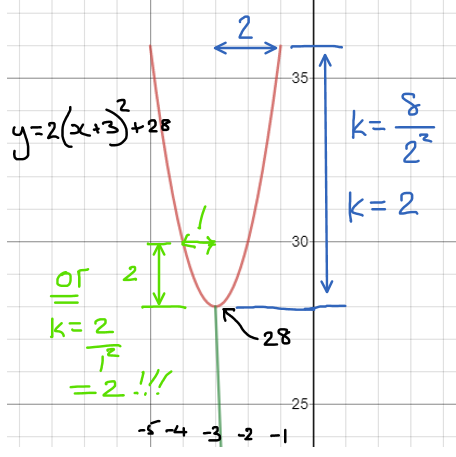
For Merit you need to translate and reproduce the graph, giving equations for the new design. The new design must not overlap the original. In terms of the level of difficulty, both horizontal and a vertical translation must be carried out. We begin with a really simple example to get the idea of what is requred. In the example below there is not a lot of space to work with, but a horizontal and vertical translation can be done. Starting simple with some parabola design, write their equations and state their domains for Achieved.
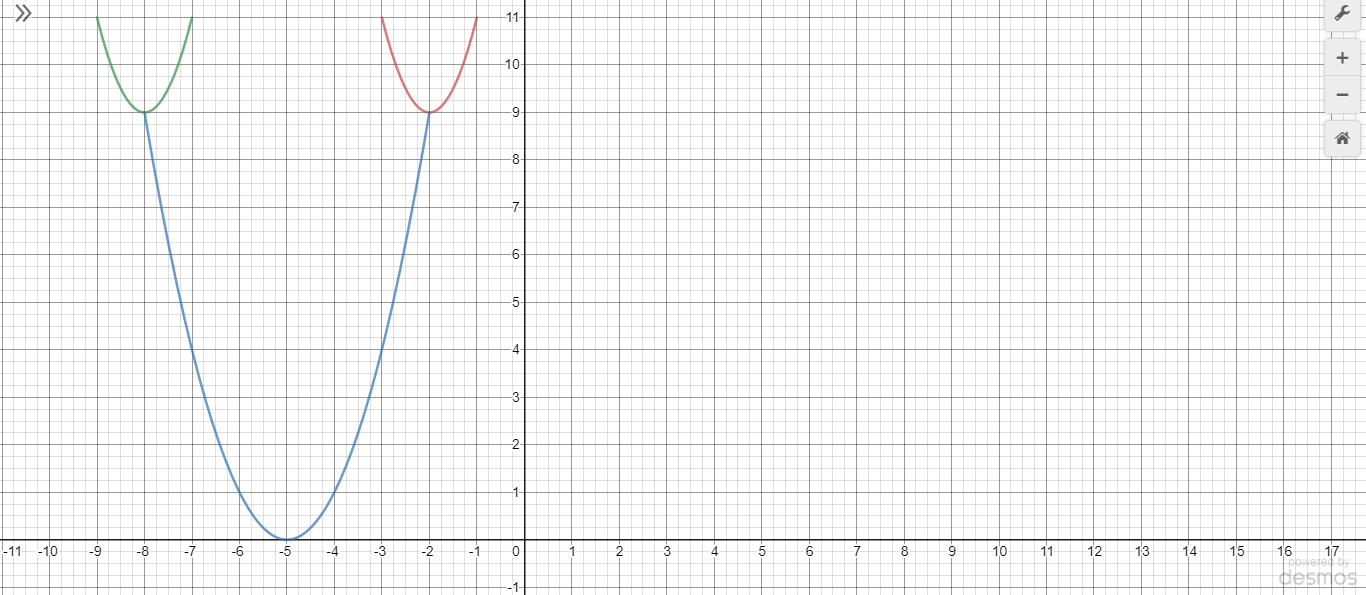
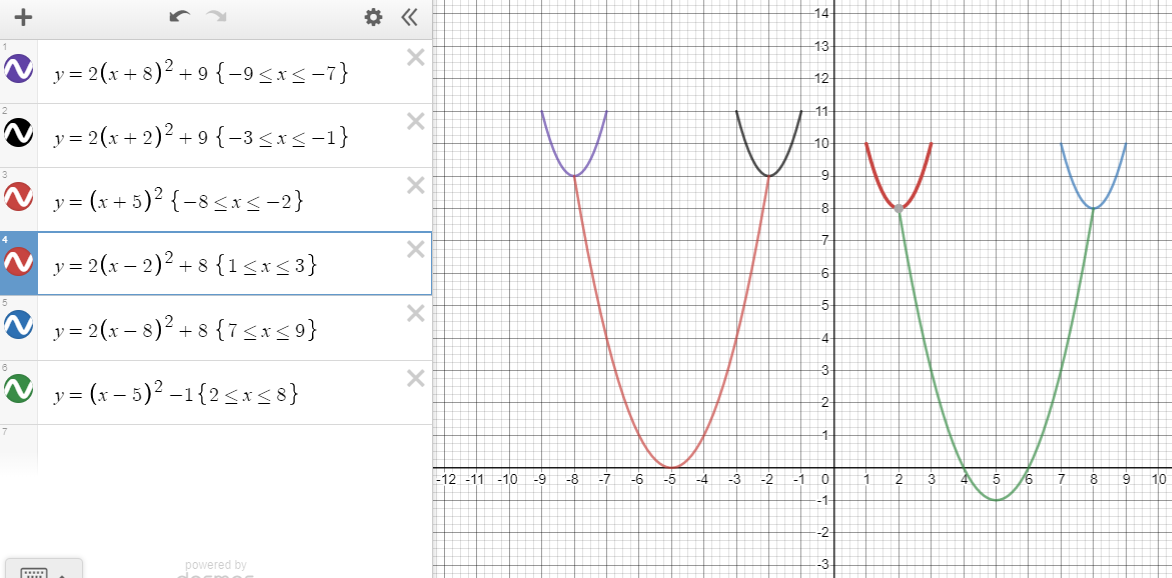
Image below showing the equations and domains for the three parabolas.
The domains should be explained further as follows:
Graph 1 - Domain, x is between -9 and -7
Graph 2 - Domain, x is between -3 and -1
Graph 3 - Domain, x is between -8 and -2
Graph 1 - Domain, x is between -9 and -7
Graph 2 - Domain, x is between -3 and -1
Graph 3 - Domain, x is between -8 and -2
This is just one example of what can be achieved for Merit by translating the image to a new location. New equations need to be stated and domains explained in detail.
example 2
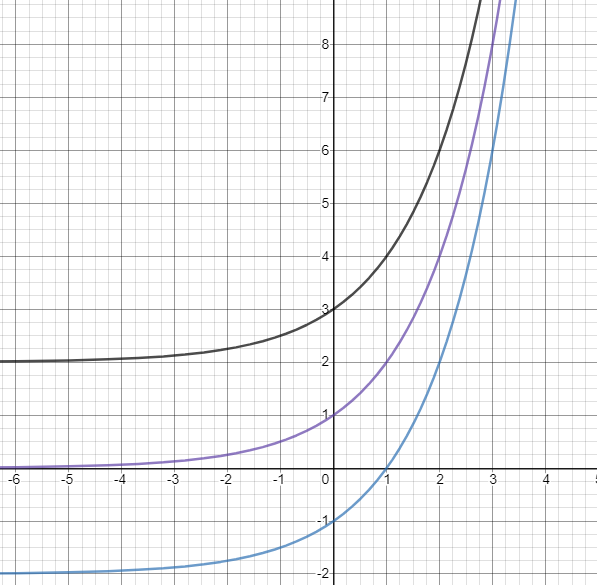
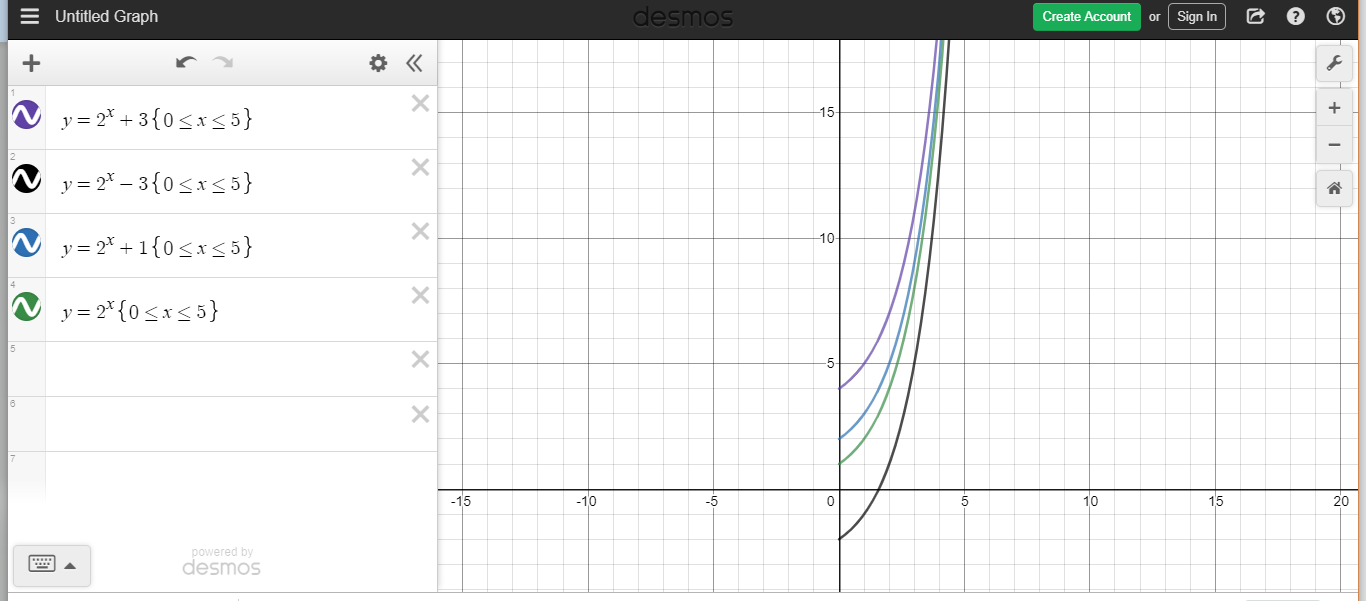
Exponential graphs
cubic graphs
practice example 1
Give at least two equations and domains for the picture or a new design. The equations must be non-linear and be different function types, like a parabola and an exponential or a parabola and a cubic.
Minor errors in the domains will not be penalised. The equations that define the domains must be explained in words, eg for the exponential graph, x is between 0 and 4.
For Merit:
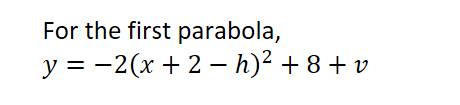
The image has been moved 7 squares to the right and one square down. The equation and domain for parabola 1 would be now be
The image has been moved 7 squares to the right and one square down. The equation and domain for parabola 1 would be now be

for x between 3 and 7.
The number in the brackets has been decreased by 7 for the movement 7 to the right and the number outside of the brackets has been decreased by 1 for a downward movement of 1. The domains have increased by 7. This applies to all other shapes in the image.
The number in the brackets has been decreased by 7 for the movement 7 to the right and the number outside of the brackets has been decreased by 1 for a downward movement of 1. The domains have increased by 7. This applies to all other shapes in the image.
Excellence:
When the picture is translated horizontally by a factor of “h” and vertically by a factor of “v” the translation is shown by the equations as follows:
When the picture is translated horizontally by a factor of “h” and vertically by a factor of “v” the translation is shown by the equations as follows:
Repeat the process for each of the remaining graphs.
practice example 2
Achieved
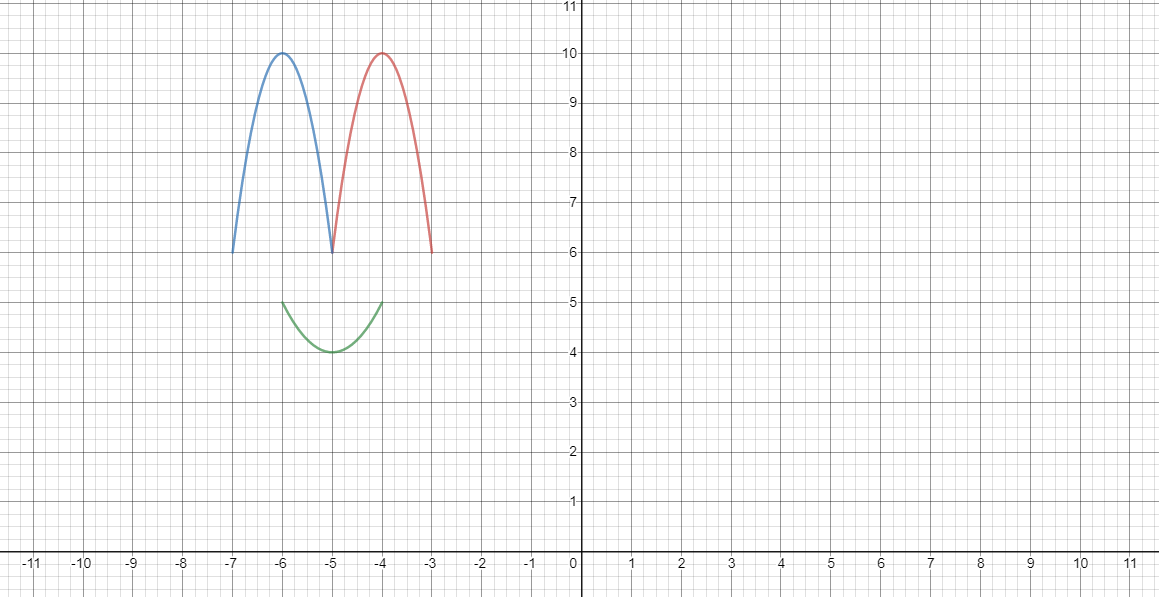
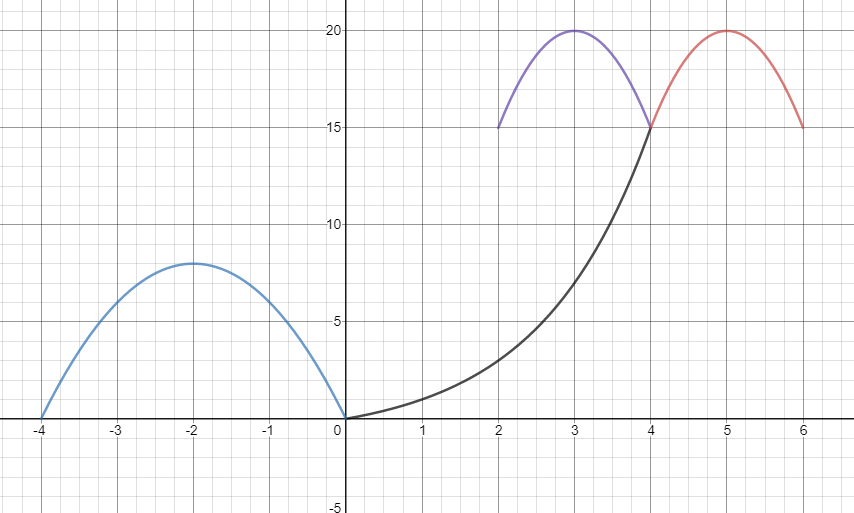
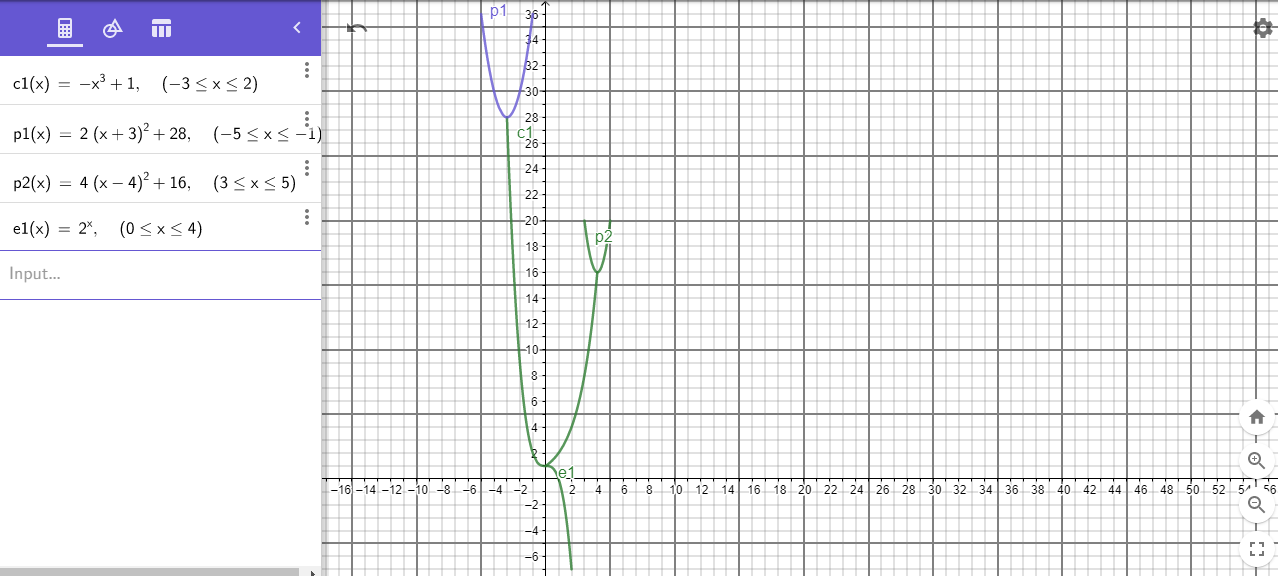
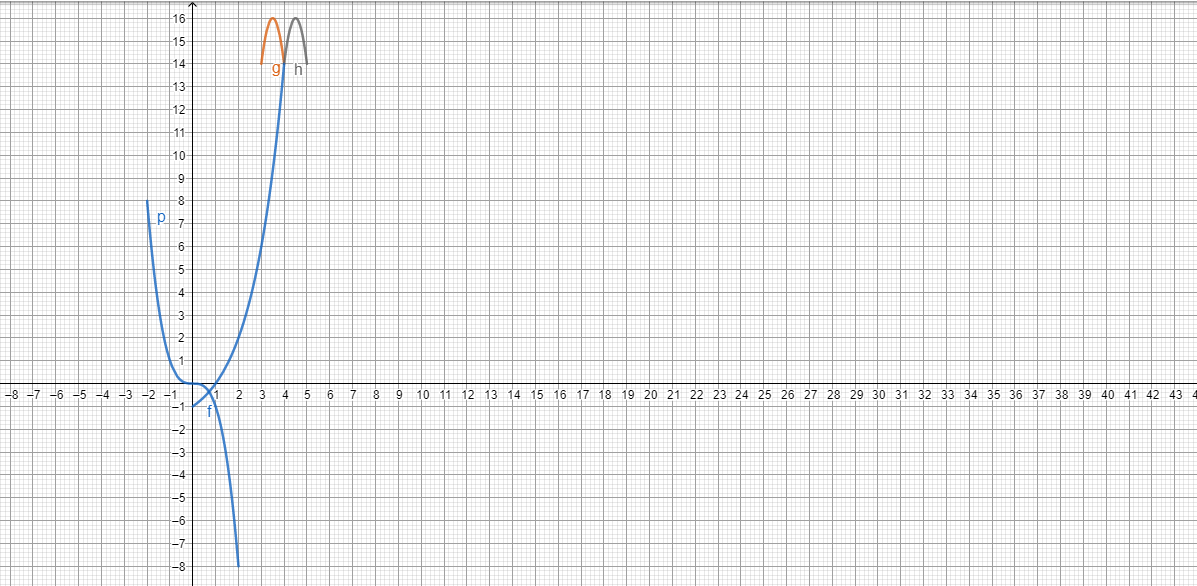
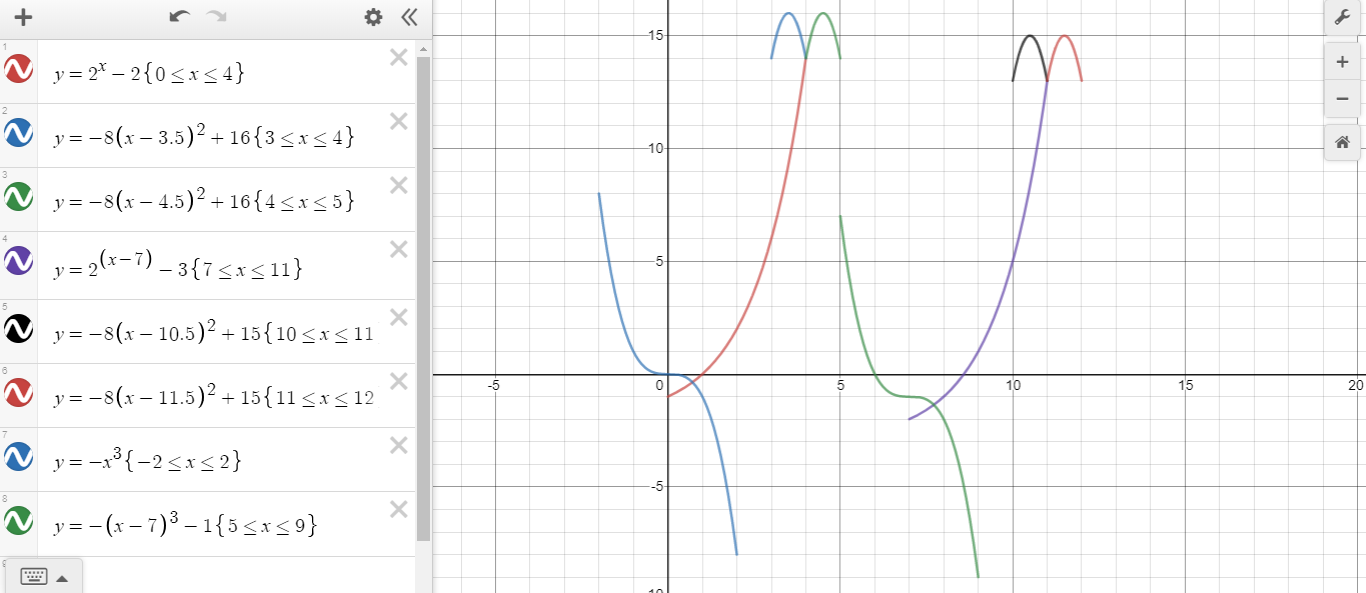
Below is a picture of a design. Find the equations and domains needed to reproduce the picture as shown below.
Below is a picture of a design. Find the equations and domains needed to reproduce the picture as shown below.
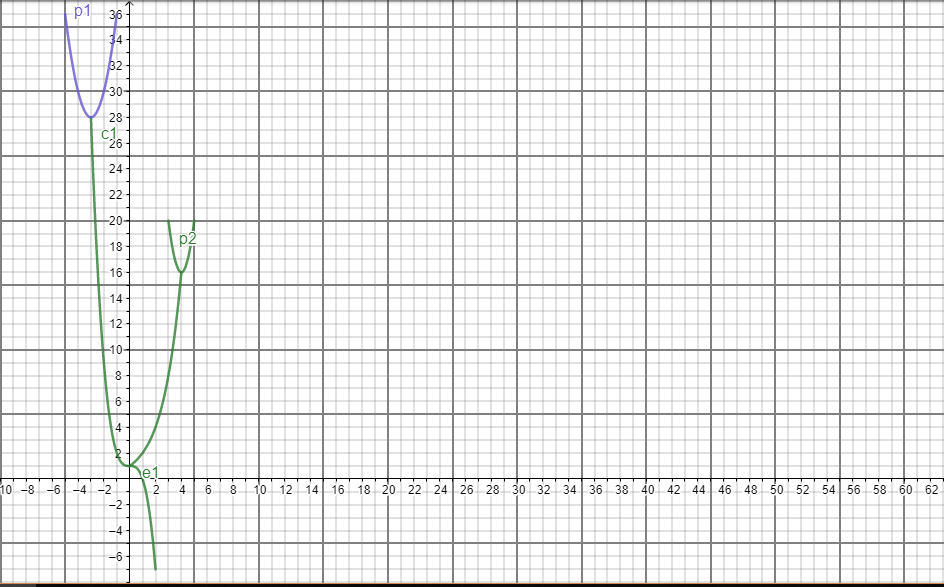
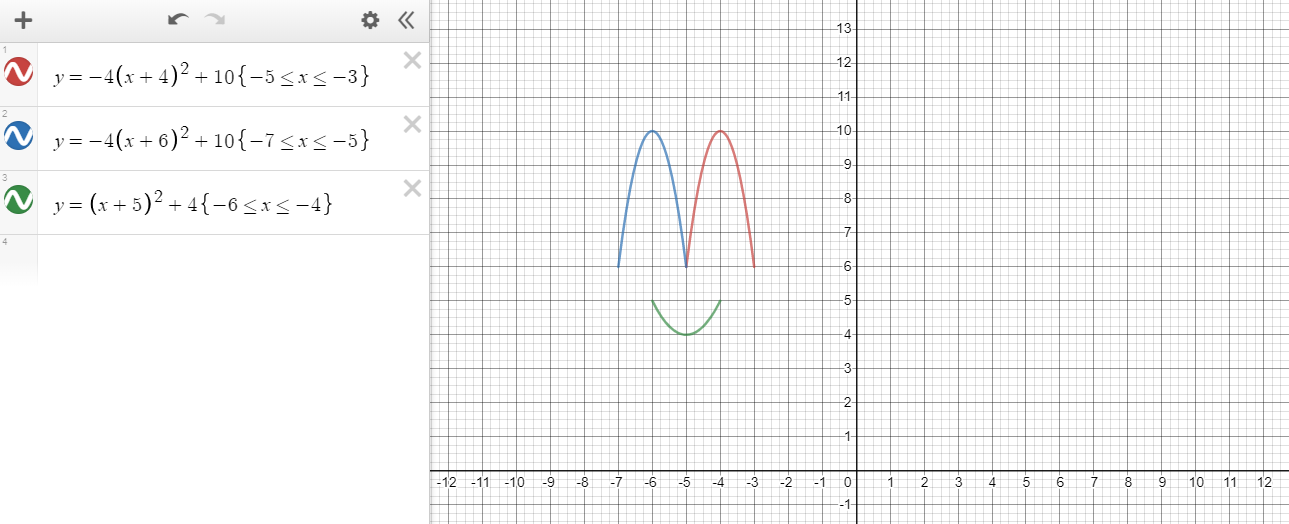
answers
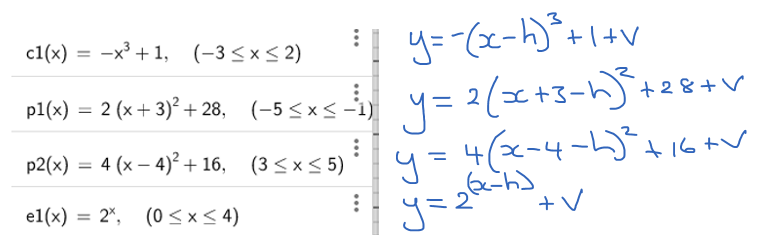
Parabola p1:
|
For the domain, x is between -5 and -1.
|
|
For the domain, x is between 3 and 5.
|
|
For the domain, x is between 0 and 4.
|
|
For the domain, x is between -3 and 2.
|
Merit
Make a pattern using the picture above. Move the picture so that it doesn’t overlap the original picture (this should include a vertical and horizontal movement).
Investigate changing the position of the picture. Use the grid above to sketch the new picture and find the equations and domains needed to produce the new picture. Alternatively, use a programme like Desmos to achieve this.
Comment on how the transformation affected the equations of the original picture.
possible solution to the problem
The Translation Rule (for this example)
The number in the brackets has been decreased by the horizontal translation value for the movement to the right and the number outside of the brackets has been decreased by the vertical translation value for the downward movement. The domains have increased by the horizontal tranlation value.
The number in the brackets has been decreased by the horizontal translation value for the movement to the right and the number outside of the brackets has been decreased by the vertical translation value for the downward movement. The domains have increased by the horizontal tranlation value.
how this applies to the problem
I moved the picture 10 places to the right and 1 place down. This means the equation and domain for the first parabola would be:
The number in the brackets has been decreased by 10 for the movement 10 to the right and the number outside of the brackets has been decreased by 1 for a downward movement of 1. The domains have increased 10.
Repeat the process for the 3 remaining graphs. See below for their equations and domains.
Excellence
When the picture is translated horizontally by a factor of “h” and vertically by a factor of “v” the translation is represented in the equations as follows:
N.B. These are based on the equations of the original image.
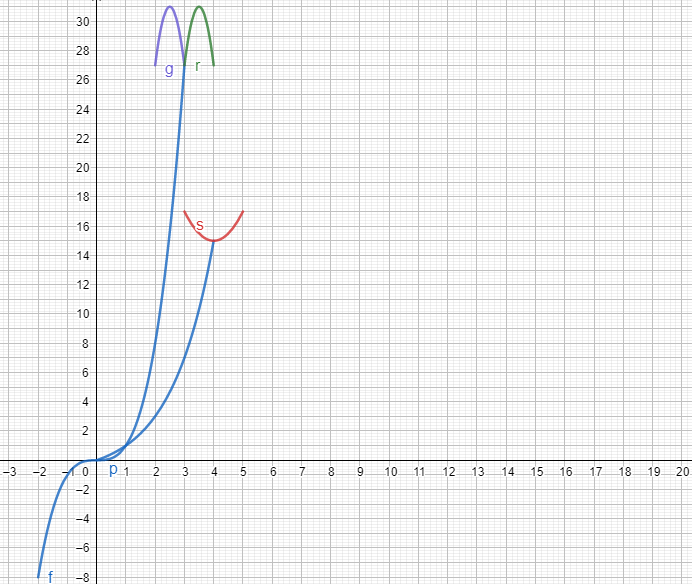
Practice example 3
Find and describe equations that model sections of the picture and investigate possible changes.
Write general equations for each of the functions.
Write general equations for each of the functions.
equations and domains
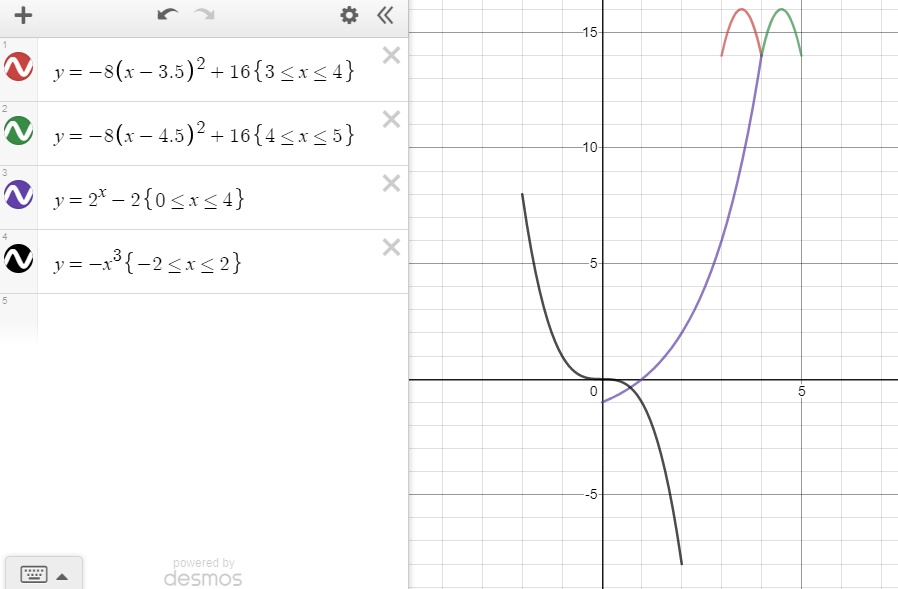
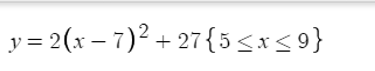
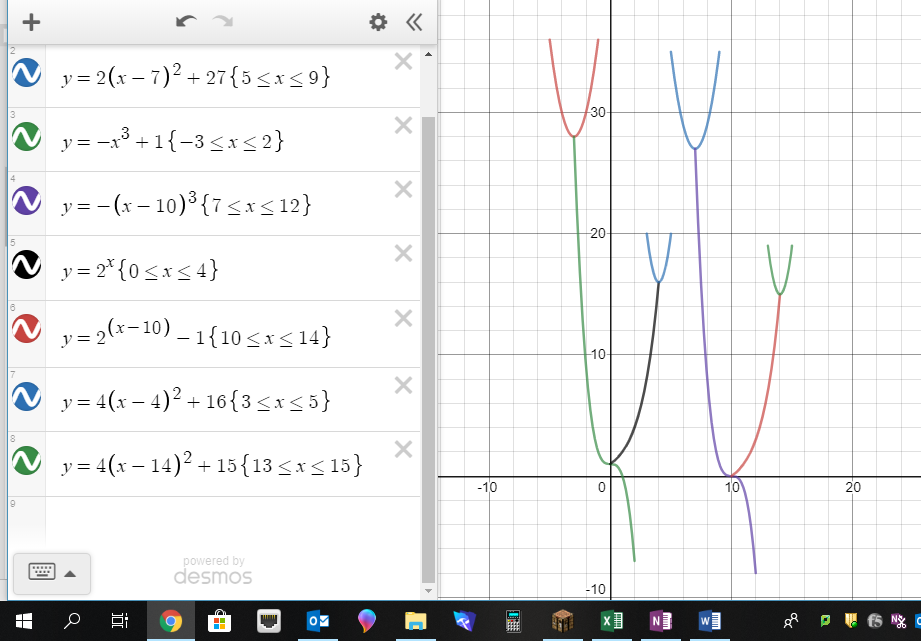
I moved the picture 7 places to the right and 1 place down. This means the equation and domain for the first parabola (labelled red above) would be:
The number in the brackets has been decreased by 7 for the movement 7 to the right and the number outside of the brackets has been decreased by 1 for a downward movement of 1. The domains have increased 7.
Repeat the process for the remaining graphs. See below for their equations and domains.
Repeat the process for the remaining graphs. See below for their equations and domains.
Excellence
When the picture is translated horizontally by a factor of “h” and vertically by a factor of “v” the translation is represented in the equations as follows:
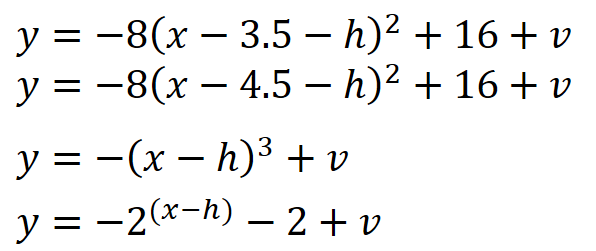
example 4
Find and describe equations that model sections of the picture and investigate possible changes.
Write general equations for each of the functions.
Write general equations for each of the functions.
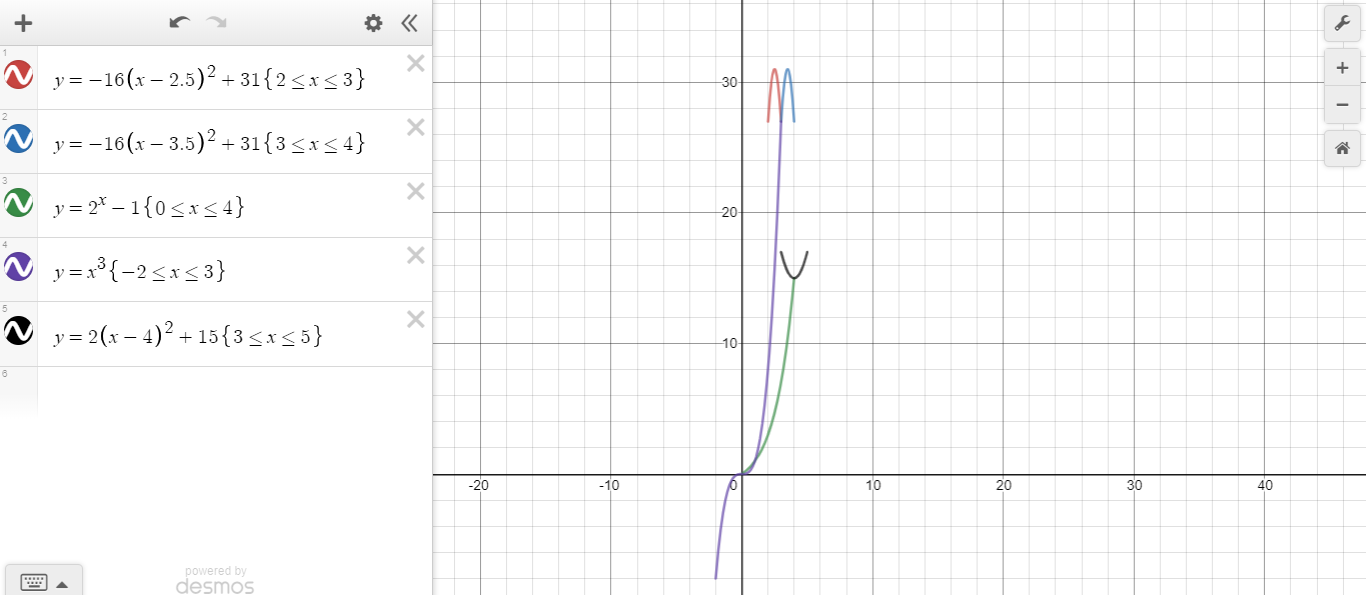
merit
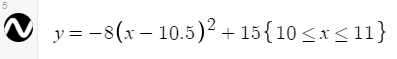
I moved the picture 7 places to the right and 1 place down. This means the equation and domain for the first parabola (red above) would be:
