
bivariate data
Height and Armspan investigation
10YEA
problem:
I notice that boys on the basketball court with long arms and legs are usually quite tall. Also looking around my class, I don't see shorter students with long arms and legs. That would look strange as our bones usually grow in proportion to our height. I would like to investigate this further. The armspan is the length from the middle finger of one hand to the middle finger of the other hand with the arms held horizontal. I think that as the height of a student increases the armspan of the student will also increase. So I think that there will be a positive relationship between the height and armspan of year 10’s in my math class
My question is: I wonder if there is a relationship between height and armspan of the students in my YR 10 at HHS in 2021.
My question is: I wonder if there is a relationship between height and armspan of the students in my YR 10 at HHS in 2021.
plan:
Measurement:
To measure the heights of students we will use a fixed vertical ruler on the wall positioned 1 m above the floor. This is called the height measuring station. A tape measure will be used to measure armspan.
To manage sources of variation (being consistent) in height measurement, our group will:
1) Shoes off, feet flat on the floor, standing straight, (to remove error due to differing sole thickness).
2) measuring to the nearest cm
3) Use a book, level on top of the head to ensure a correct reading.
To manage sources of variation (being consistent) with armspan, our group will,
1) Have arms spread out wide and level, middle finger of one hand touching the wall to make measuring easier.
2) Use the tape measure, measure from middle finger to middle finger, (not the nails) to the nearest cm.
In my group of three, Wendy will place a hard ruler on top of Maniah's head and read the measurement that is parallel to the ruler in cm out loud and I will record the measurement on paper. We will then measure each others armspans to the nearest centimeter, using a tape measure measuring. Readings are then given to the teacher who will produce a spreadsheet which is uploaded to Classroom for us to copy and input into NZGrapher where we will produce a scatter graph.
Scale values: Measurements for height and armspan will be to the nearest cm. Half cm readings were rounded up.
The variables:
The explanatory (independent) variable (x axis) is the height of students in cm and the (response) dependent variable (y axis) is their armspan in cm.
Sample size:
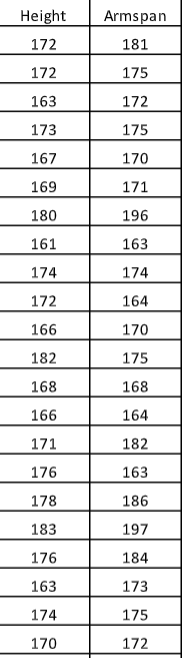
There are 22 students in our sample. (This is NOT enough, because we need 25 to 30 students in our class for an appropriate sample that can be used to represent a larger group of students such as YR10 students at HHS) Some students were absent on the day of measuring but worst case we can borrow some data from another class if needed.
The explanatory (independent) variable (x axis) is the height of students in cm and the (response) dependent variable (y axis) is their armspan in cm.
Sample size:
There are 22 students in our sample. (This is NOT enough, because we need 25 to 30 students in our class for an appropriate sample that can be used to represent a larger group of students such as YR10 students at HHS) Some students were absent on the day of measuring but worst case we can borrow some data from another class if needed.
data:
analysis: T-A-S-G-U-S
Trend:
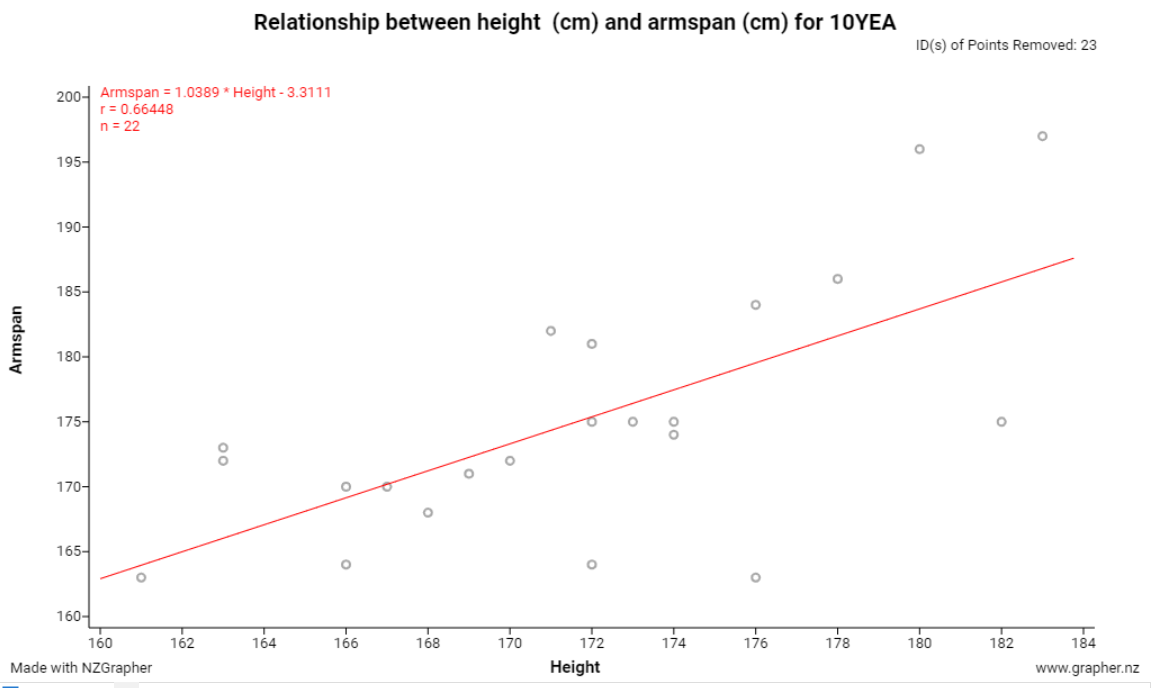
Looking at my graph, I notice that there is a linear relationship between height (cm) and armspan (cm) of the students in 10YEA. This is because the data points form a line with a gradient. I don't see a curve in the data points.
Association:
I can see that the association is positive because the trend line slopes upwards from left to right, so as the heights of students increases so does their armspan. https://screencast-o-matic.com/watch/crjOjFVQeGe
Strength:
The relationship is linear, moderate but not strong. The pattern of dots is not that close to the trend line and are spread out above and below to form a consistent pattern.
Grouping:
Looking at the graph I can't see any specific groups in the scatter graph. This means there is a good variety of data measurements for the height that are spread out evenly across the trend line.
Unusual values or outliers:
The tallest student at 182cm doesn't have the longest armspan. Two students around 176cm in height have different armspan lengths, one 188 cm and 182 cm respectively. This could be due to an error in measurement or its simply genetics. I wood recheck those students measurements.
Scatter:
The scatter appears to be reasonably consistent up to where students are around 165 cm. After this the scatter expands or fans out further above and below the trend line an equal amount.
The scatter appears to be reasonably consistent up to where students are around 165 cm. After this the scatter expands or fans out further above and below the trend line an equal amount.
conclusion:
Conclusion
After the investigation of the sample data we collected, there is a moderate positive linear
relationship between the height and armspans of students in our YR10 class at Henderson High School. This is what I expected as these are body parts that grow in proportion.
As the trend line slopes upwards, there is a positive relationship which shows that as the height increases in length, the armspan increases as well. I am not surprised by this because I was expecting the linear relationship as we grow in proportion.
Improvements: (Not needed at achievement level)
I could improve my investigation by increasing my sample size and randomly select
students rather than just from one class. However, I predict that my current results from my class will reflect those of other YR10 classes at Henderson High.
