
TIME SERIES 2
trend
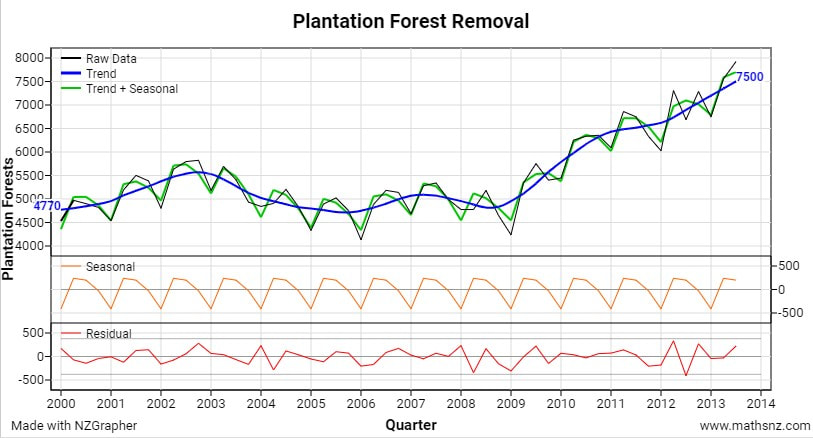
By looking at the recomposed data in the graph I can see that overall the amount of plantation forest logged appears to be increasing from about 4770 million meters cubed average in 2000 to about 7500 million meters cubed on average in Q3 of 2013. This is a difference of 2730 million metres cubed. After 2003 there was a decline in logging for about three years falling to around 4700 million meters cubed. A factor contributing to increased logging could be due to the the housing boom due to increased immigration putting demands on domestic houses.
Seasonal Pattern
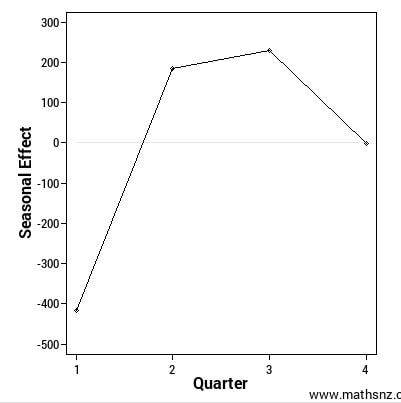
Is there an obvious seasonal pattern?
When is the pattern at its lowest point?
When is it at its highest point?
what is the difference?
|
|
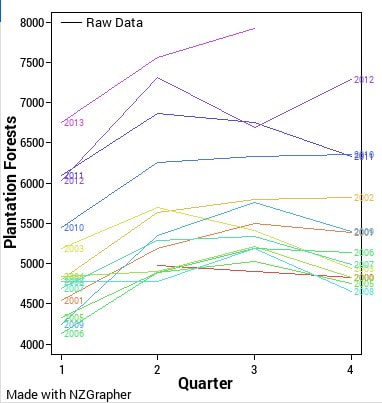
There is an obvious seasonal pattern. The largest amount of logging of plantation forests normally occurs during the 3rd quarter (July to September) when the amount of logging is on average about 200 million cubic meters of timber above the long term trend. Between the 3rd quarter and the 1st quarter (October to January) of the following year there is a decline in logging production on average reaching a minimum value of in excess of 400 million cubic meters of timber less than the long term trend. This is a difference of 600 million cubic metres of timber. Some years don't follow this pattern, for example, the last 3 seasons (2011 to 2013) where the peak happens in the 2nd quarter. Logging appears to be at a maximum during the cooler period of the year where it may be used for fuel during winter.
